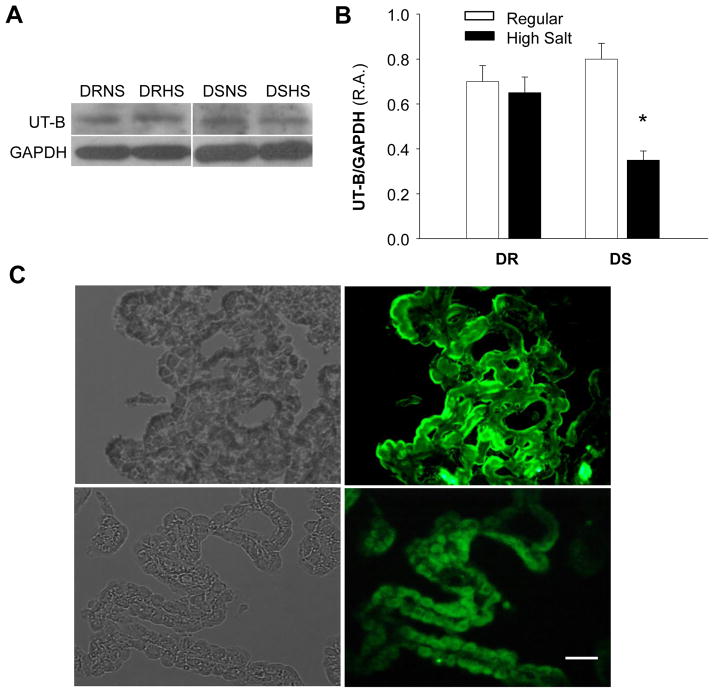
Figure 4.
UT-B protein expression in the choroid plexus of Dahl S vs. Dahl R rats on regular and high salt diet. A, Representative autoradiograms showing the protein levels of UT-B and GAPDH in the choroid plexus of Dahl S (DS) and Dahl R (DR) treated with either normal salt (NS) or high salt diet (HS) for two weeks. B, Bar graphs showing the protein levels of UT-B in the choroid plexus of Dahl S (DS) and Dahl R (DR) treated with either regular salt or high salt diet for two weeks. Data are normalized using GAPDH. UT-B expression was reduced in the choroid plexus of Dahl S rats on high salt diet. Data are mean±SE from 4 repeated experiments and 8 rats in each group. C, Localization of UT-B protein in the choroid plexus of Dahl S rats on regular diet (upper two panels) and high salt diet (lower two panels). Left two panels showing the choroid plexus in optical phase; and fluorescent micrographs in right two panels showing the same area stained with specific anti-UT-B antibodies. Bar, 100 μm.

