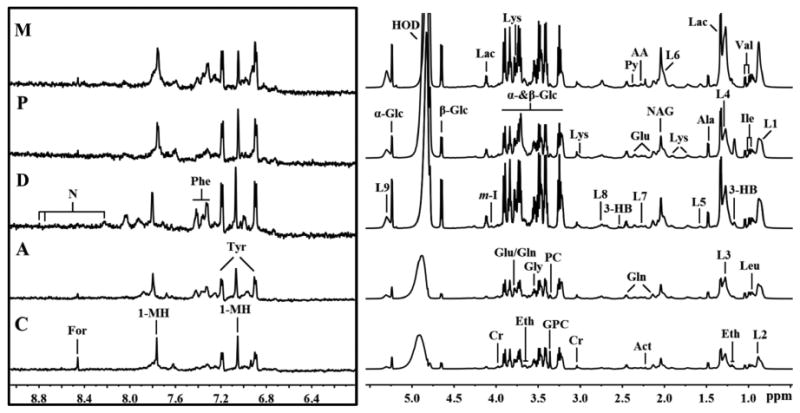
Fig. 1. Representation of 600 MHz 1H NMR CPMG spectrum (δ0.5-5.6 and δ5.6-9.5) of plasma obtained from subjects with malignancy (M), community-acquired pneumonia (P), diabetes mellitus (D), TB (A), and healthy controls (C).

The region of δ5.6-9.5 (in the box) was magnified 16 times compared with the corresponding region of δ0.5-5.6 for the purpose of clarity. Keys: 1-MH: 1-Methylhistidene; AA: Acetoacetate; Ace: Acetate; Act: Acetone; Ala: Alanine; Cr: Creatine; Eth: Ethanol; For: Formate; Gln: Glutamine; Glu: Glutamate; Gly: Glycine; GPC: Glycerolphosphocholine; Ileu: Isoleucine; L1: LDL, CH3- (CH2)n-; L2: VLDL, CH3- (CH2)n-; L3: LDL, CH3- (CH2)n-; L4: VLDL, CH3- (CH2)n-; L5: VLDL, -CH2-CH2-C=O; L6: Lipid, -CH2-CH=CH-; L7: Lipid, -CH2-C=O; L8: Lipid, =CH-CH2-CH=; L9: Lipid, -CH=CH-; Lac: Lactate; Leu: Leucine; Lys: Lysine; MA: Methylamine; NAG: N-acetyl glycoprotein signals; PC: Phosphocholine: Phe: Phenylalanine; Py: Pyruvate; Tyr: Tyrosine; Val: Valine; α-Glc: α-Glucose; β-Glc:β-Glucose.
