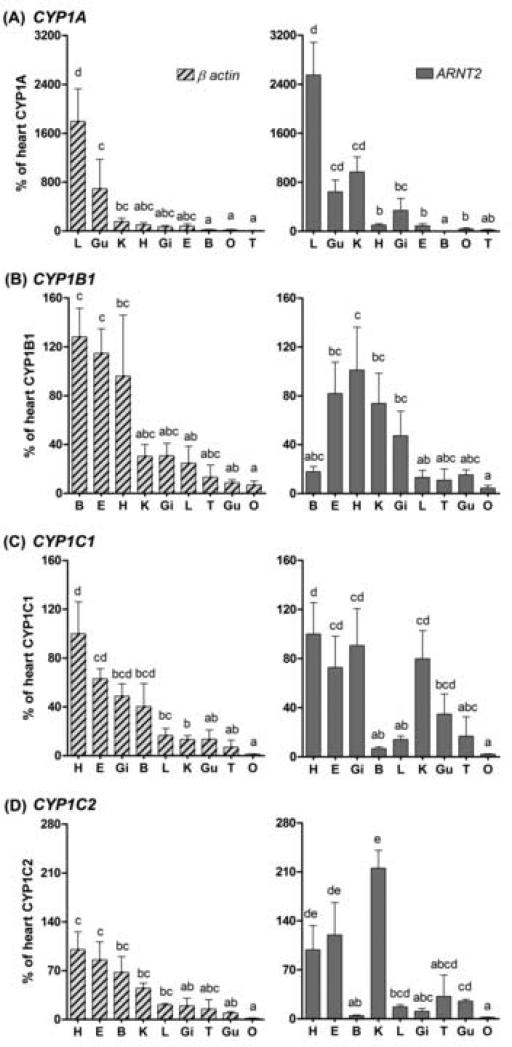
Fig 4.
Basal levels of CYP1 transcripts in various organs of the zebrafish PS as a percentage of the expression level in heart (i.e., heart was used as a calibrator organ). Data were normalized to both reference genes, β-actin and ANRT2. B, brain; E, eye; Gi, gill; Gu, gut; H, heart; K, kidney; L, liver; O, ovary; T, testes. Differences between groups were determined by one-way ANOVA followed by Tukey's Multiple Comparison Test after log-transformation. A statistical difference between groups at p < 0.05 is indicated by differences in the letters above the bars.

