Figure 4.
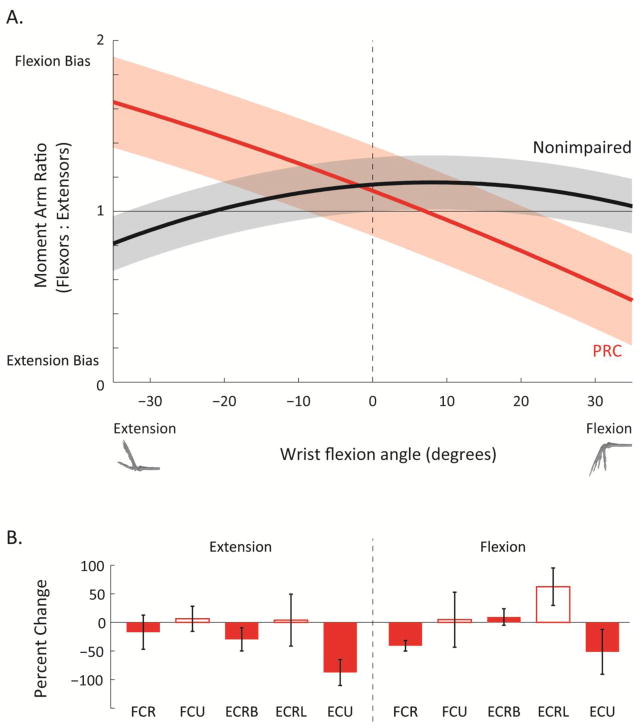
Comparison of flexion-extension moment arms for the nonimpaired (black) and PRC (red) wrists. (A) Ratio between the sum of the moment arms of the primary wrist flexors and the sum of the moment arms of the primary wrist extensors plotted as a function of joint angle. Solid line indicates the average ratio across all specimens; shaded area represents the 95 percent confidence interval about the average. (B) Percent change in individual flexion moment arms for the primary wrist muscles in the PRC wrist relative to the nonimpaired wrist. Bars to the left of the dashed line indicate average percent change for wrist extension (joint angles between −35 to 0 degrees); bars to the right indicate average percent change for wrist flexion (joint angles between 0 to 35 degrees). Filled bars indicate muscles with statistically significant changes in moment arm, zero percent represents no change from the nonimpaired condition, and error bars represent one standard deviation.

