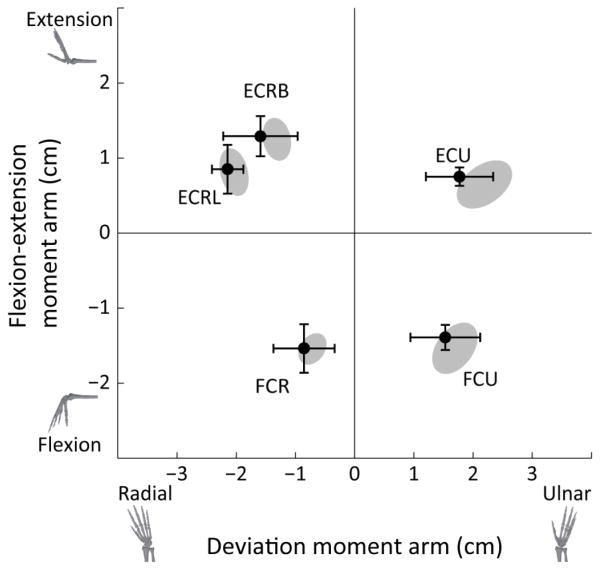
Figure 7.
Nonimpaired moment arms measured in this study (black, filled circles) compared to those reported in the literature; flexion-extension moment arms are plotted as a function of deviation moment arms. The values are measured moment arms averaged across joint angles. Ellipses are centered at the average of previously reported moment arms and enclose one standard deviation of those previously reported averages [19, 20, 22, 24, 25, 26]. Error bars on data measured in this study represent one standard deviation.

