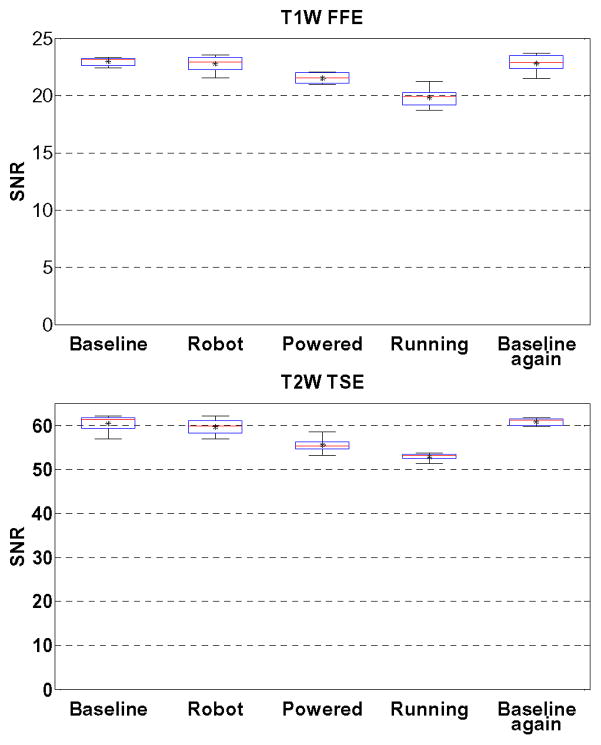
Fig. 10.
Boxplots showing the range of SNR values for each of five robot configurations evaluated in two clinically appropriate neuro imaging protocols (T1W FFE & T2W TSE). The configurations include Baseline (no robotic system components present in room), Robot (robot presented but not powered), Powered (Robot connected to power on controller), Running (Robot moving during imaging), and a repeated baseline with no robotic system components present.

