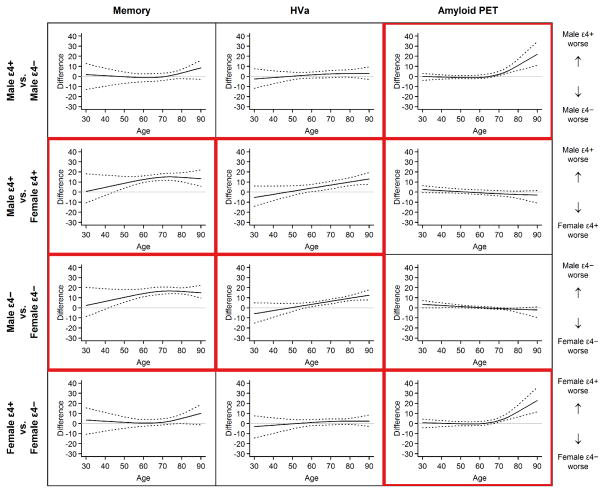
Figure 3.
Plots of Groupwise Differences in Scaled Units for Memory, Adjusted Hippocampal Volume (HVa), and Amyloid Positron Emission Tomography (PET). Comparisons are shown for differences among APOE ε4 carriers vss noncarriers within sex and for male vs female within APOE ε4 genotype. The solid line in each plot represents the estimated difference in medians, while the dotted lines represent 95% bootstrap CIs for this difference. A horizontal line at 0 (ie, no difference) is shown for reference. Plots in which significant groupwise differences were found are outlined in red. This red outlining illustrates a pattern showing differences in memory and HVa were due to sex not APOE ε4, while differences in amyloid PET were due to APOE ε4 and not sex.

