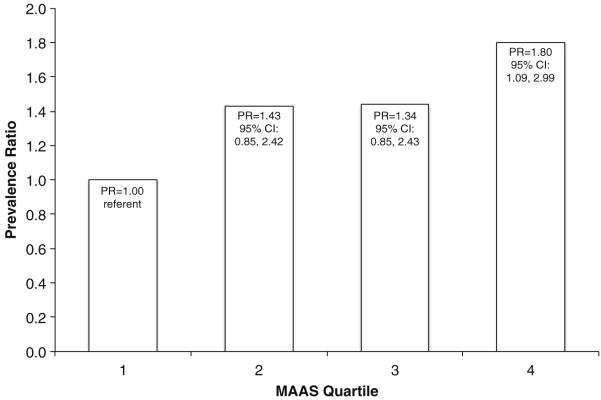
Fig. 3.
Prevalence ratios (95 % confidence intervals) of good cardiovascular health according to mindfulness quartile, adjusted for age, sex, and race/ethnicity. Point estimates represent prevalence ratios of having ≥4 ideal cardiovascular health components per Mindful Attention Awareness Scale (MAAS) quartile. Quartiles 1 and 4 represent the lowest and highest MAAS quartile, respectively. Sample sizes for quartiles 1, 2, 3, and 4 are 94, 91, 103, and 94, respectively

