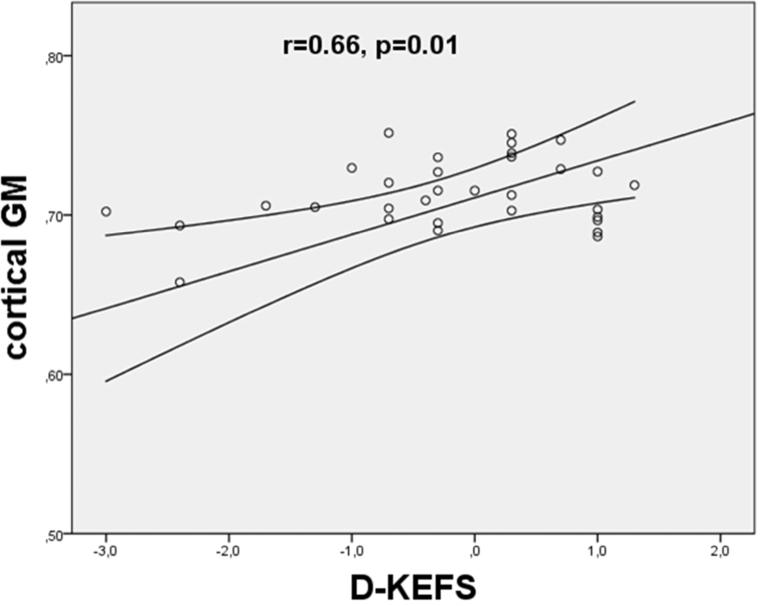
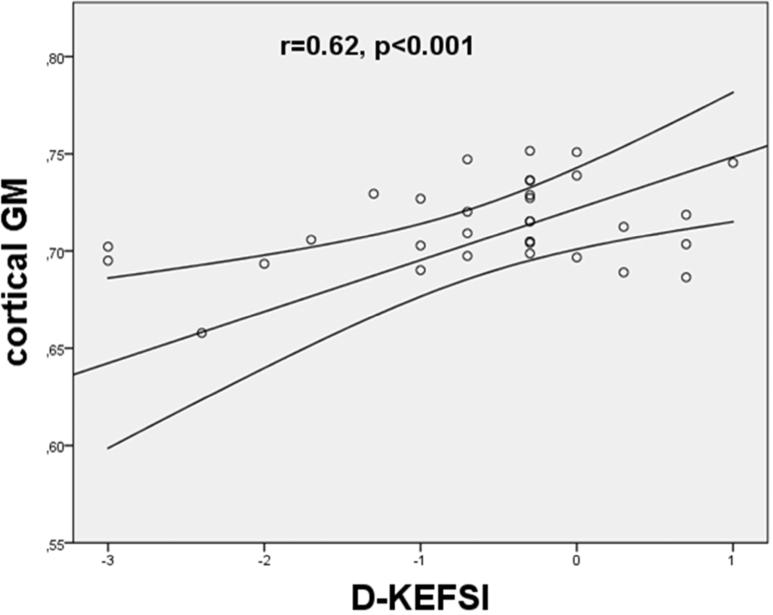
Figure 2.
Scatterplot of the mean kurtosis in cortical gray matter versus outcome in neuropsychological tests ([a] D-KEFS = Delis-Kaplan Executive Function System; [b]DKEFSI = Color-Word Interference Test: Inhibition). The MK values were found to significantly correlate with the poor outcome in D-KEFS (p = 0.005) and D-KEFSI (p = 0.003). The lines represent the linear fit with a confidence intervall of 95%.


