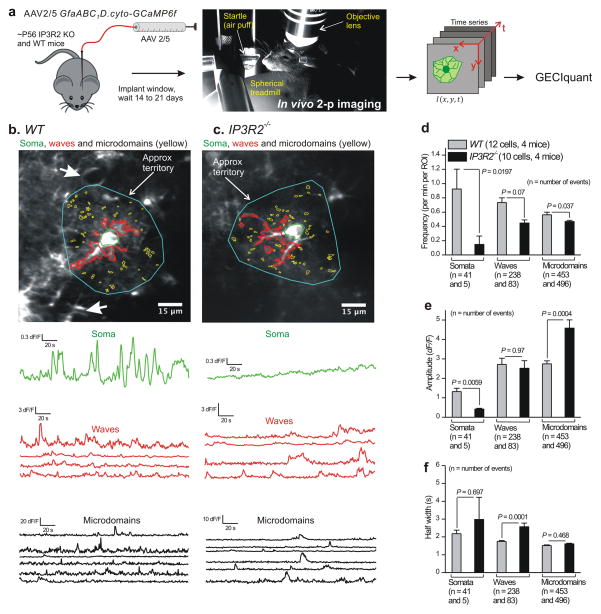
Figure 5. Abundant Ca2+ fluctuations persist in astrocyte processes from WT and IP3R2−/− mice in vivo.
a. Schematic illustrating the experimental approach for in vivo imaging in fully awake mice free to rest or run on a spherical treadmill (with no anesthesia). b. Representative images and traces for Ca2+ fluctuations measured in a cortical astrocyte from a WT mouse. Three predominant types of Ca2+ event are shown: somatic, waves and microdomains. Approximate territory boundaries are outlined in blue, but were not used for data analyses and are shown only for illustrative purposes. c. As in b, but for an astrocyte from an IP3R2−/− mouse. Representative movies are Supplementary movies 5 and 6. d–f. Average data for astrocyte Ca2+ fluctuation properties from WT and IP3R2−/− mice during in vivo imaging (n = 12 astrocytes and 4 mice for each). As stated in the figure, the n numbers refer to the numbers of Ca2+ fluctuations for each bar, which were averaged for frequency, amplitude and half-width across all cells in panels d–f. The data are shown as mean ± s.e.m.

