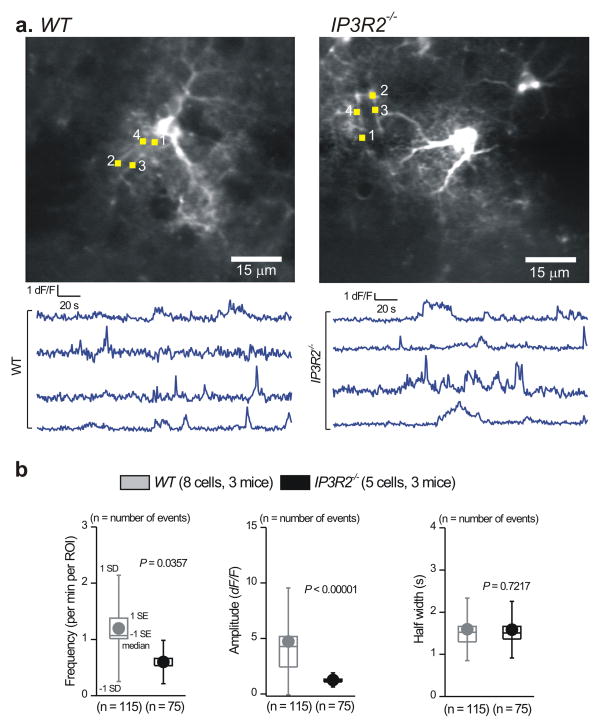
Figure 6. Ca2+ fluctuations persist in vivo within endfeet of cortical astrocytes from IP3R2−/− mice.
a. Representative traces and images for Ca2+ fluctuations measured in astrocyte endfeet from WT and IP3R2−/− mice. b. Average data for astrocyte Ca2+ fluctuation properties from WT and IP3R2−/− mice during in vivo imaging (WT: n = 7 astrocytes and 3 mice, IP3R2−/−: n = 5 astrocytes and 3 mice). The averages are across all cells and are shown as box and whisker plots.

