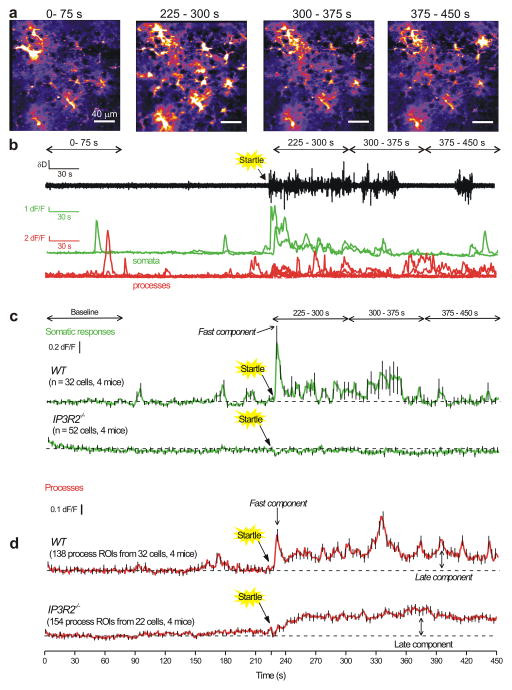
Figure 7. Endogenously evoked astrocyte process Ca2+ fluctuations recorded during in vivo startle responses reveal early and late components.
a. Representative images of Ca2+ fluctuations from cortical astrocytes before, during and after startle responses, which were evoked by a puff of air to the face of the mouse (see Methods and Supplementary movie 9). The times written above each of the images correspond to the times shown in the traces in panel b and c. Startle was evoked at 225 s. Representative data for WT and IP3R2−/− are shown in Supplementary movie 7 and 8. b. Representative traces for the animal’s locomotion on the spherical treadmill along with Ca2+ responses of cortical astrocytes for somatic and process fluctuations for the cells shown in a. Note that startle-triggered running of the mouse on the ball, as well as Ca2+ fluctuations in cortical astrocytes. c. Average data for experiments such as those in b for 32 cells from four WT and 52 cells from four IP3R2−/− mice. d. As in c, but for astrocyte process fluctuations. Note that the responses in the territory displayed a fast/early component and a slow/late component that persisted during these recordings. In the interests of clarity, error bars in panels c and d are shown for every 5th data point, but the underlying average traces are for all cells. The data are shown as mean ± s.e.m.

