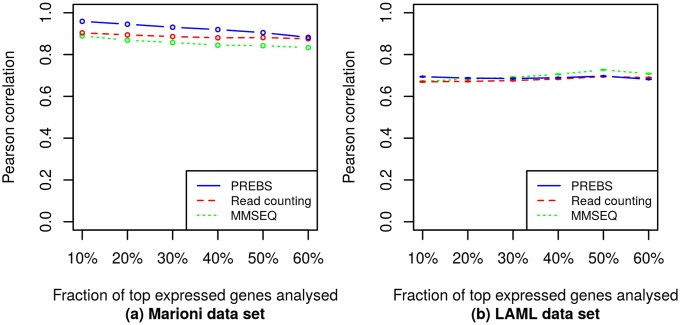
Fig 5. Averaged differential gene expression correlations (RPA mode).
The plots show average log2 fold change correlations between different RNA-seq data processing methods and the microarray. Different points correspond to different numbers of top expressed genes. The correlations are averaged over all samples in the corresponding data sets: (a) the Marioni et al. data set, (b) the LAML data set. The error bars in LAML data set plot correspond to standard errors of the mean, although the errors are so small that top and bottom bars are merged. Error bars for Marioni data set plot could not be displayed because there is only one pair of samples for which log2 fold change values were calculated.

