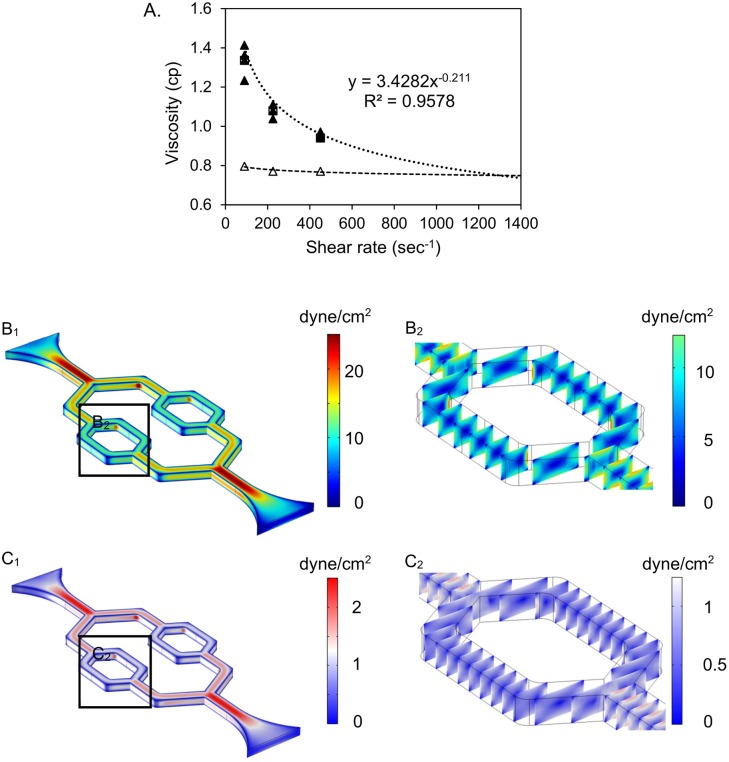
Fig 2. Viscosity measurement of culture media and numerical simulation for the wall shear stress distribution of the microchannel network.
A. Viscosity measurement of culture media perfusate. Filled triangles (▲) represent viscosity of the culture medium with 10% FBS; Open triangles (△) represent the viscosity of standard Newtonian calibration solution. Dotted and dashed lines are their trend lines, respectively. B1. COMSOL simulation shows the wall shear stress distribution through the entire network under high flow rate condition. B2. The wall shear stress distribution of the selected region in B1. C1. COMSOL simulation shows the wall shear stress distribution through the entire network under low flow rate condition. C2. The wall shear stress distribution of the selected region in C1.

