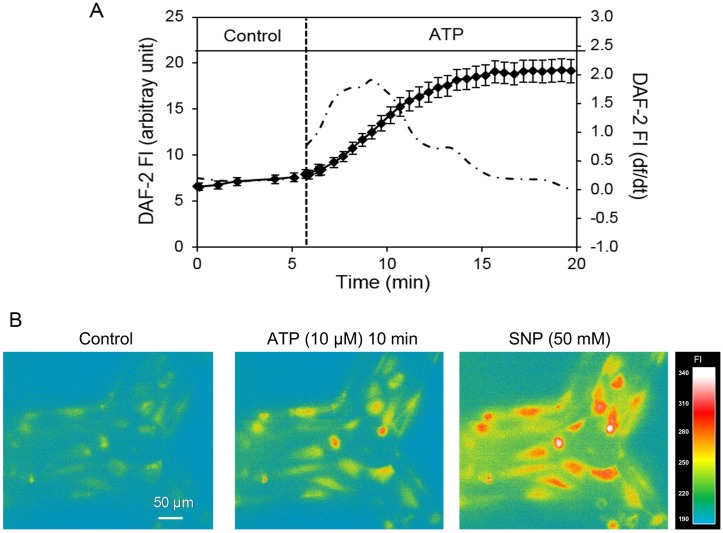
Fig 7. ATP-induced NO production in HUVECs cultured microchannel network.
A. Time dependent changes in FIDAF (left Y axis) from a representative experiment before and after ATP (10 μM) stimulation. The 1st differential conversion of cumulative FIDAF (df /dt, right Y axis) represents the NO production rate (dash-dotted line). B. Representative DAF-2 fluorescence images. ATP induced significant increases in nitric oxide (NO)-DAF-2 fluorescence intensity (FI) relative to control (left). FIDAF was further increased with the application of the NO donor sodium nitroprusside (SNP).

