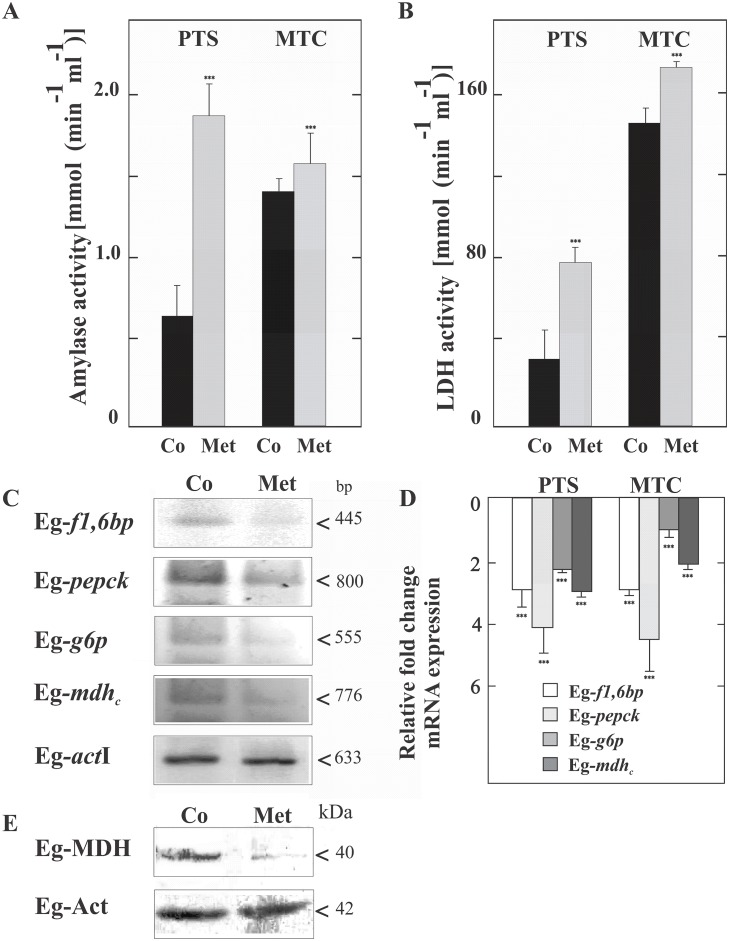
Fig 2. Metabolic and transcriptional changes induced by 10 mM metformin in parasites treated for 48 h.
Analysis of Eg-α-amylase (A) and Eg-lactate dehydrogenase (LDH) (B) activities in protoscoleces (PTS) and metacestodes (MTC). (C) Reverse Transcription (RT)-PCR analysis from total RNA of control (Co) or treated (Met) protoscoleces. Amplification of Eg-actin I (actI) was used as a loading control. Molecular sizes of amplicons are indicated with arrowheads. Eg-f1,6bp: fructose-1,6-bisphosphatase, Eg-pepck: phosphoenolpyruvate carboxykinase, Eg-g6p: glucose-6-phosphatase, Eg-mdh c: cytoplasmic malate dehydrogenase. (D) Quantitative PCR analysis from total RNA of protoscoleces (PTS) and metacestodes (MTC) treated with Met compared to controls. Fold change expression values are plotted. Data are the mean ± S.D. of three independent experiments. ***Statistically significant difference (P < 0.05) compared with control. (E) Immunoblot of Eg-MDH revealed with a polyclonal antibody. Total protein extracts from control (Co) and Met-treated protoscoleces (Met) were loaded at 100 μg of total protein/lane. Actin was used as a loading control. Polypeptide size is shown.

