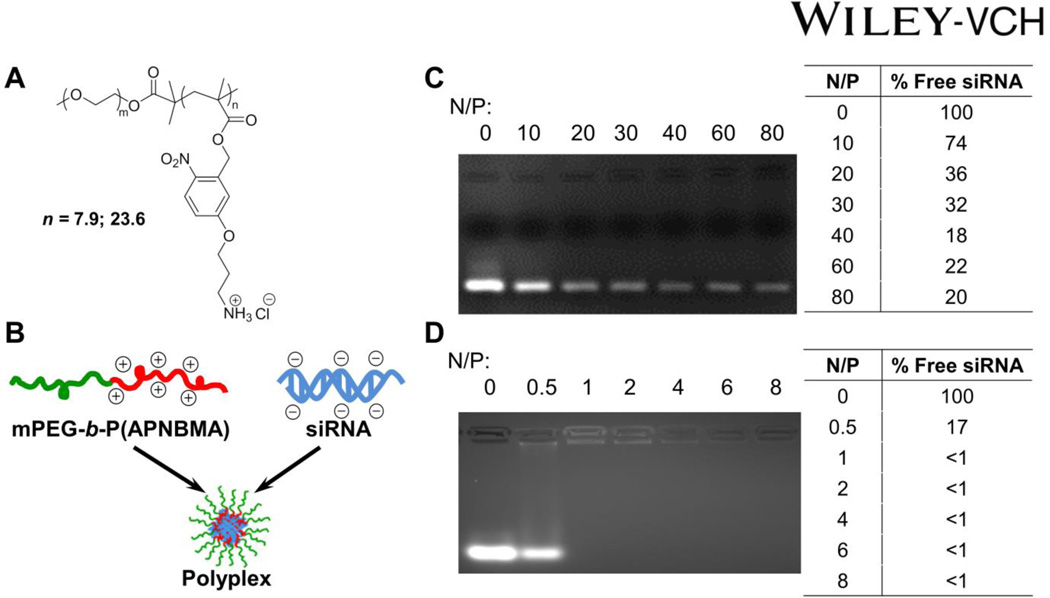
Figure 1.
(A) Chemical structure of mPEG-b-P(APNBMA)n polymers. (B) Cartoon schematic of siRNA/mPEG-b-P(APNBMA)n polyplex formation. Representative siRNA mobility assay of (C) siRNA/mPEG-b-P(APNBMA)7.9 and (D) siRNA/mPEG-b-P(APNBMA)23.6 polyplexes in 4 wt% agarose gels stained with ethidium bromide. Lane 1 of both gels is siRNA alone (N/P = 0), while the remaining lanes show siRNA complexed with polymer at varied N/P ratios. Tabulated values indicate percentages of free siRNA based on ImageJ analysis of the free siRNA band.

