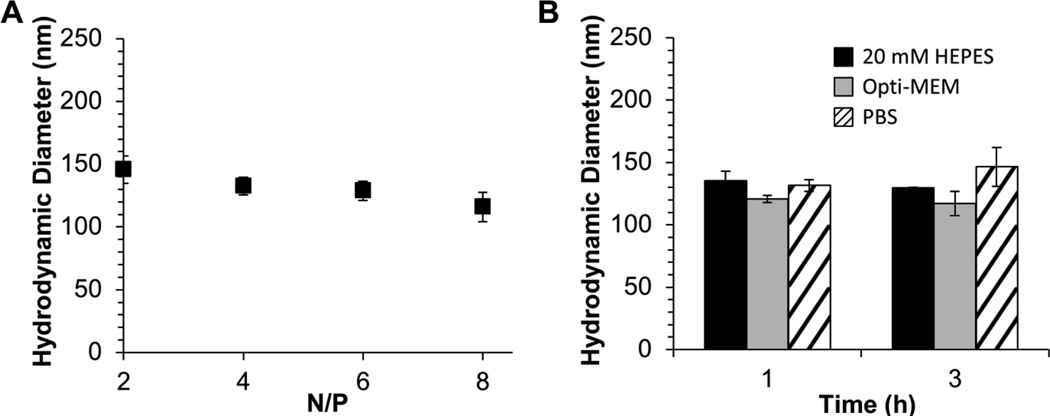
Figure 2.
Polyplex characterization using DLS. (A) DH of polyplexes determined at various N/P ratios. (B) Representative DH of polyplexes prepared at N/P = 4 following a 1 h or a 3 h incubation in 20 mM HEPES (pH = 6; black), Opti-MEM (gray), or PBS containing 150 mM NaCl (diagonal lines). Each data point represents the mean ± standard deviation for a total of three separately prepared samples.

