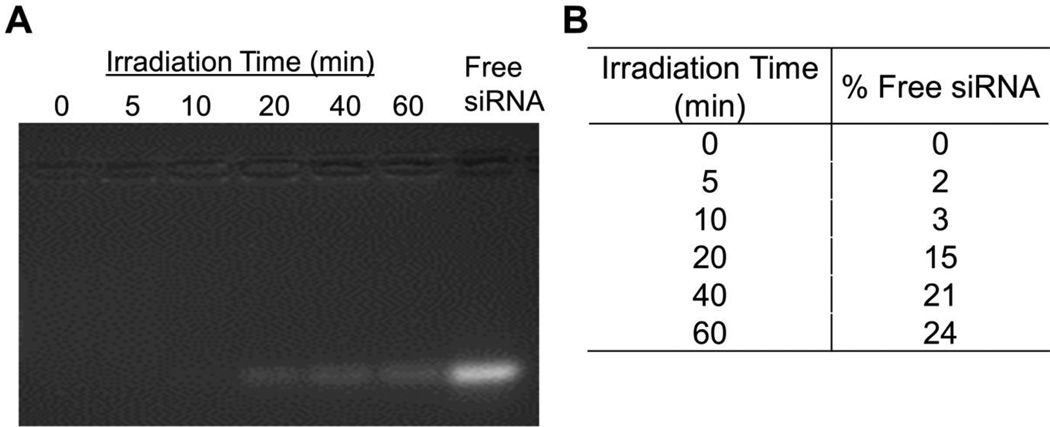
Figure 6.
(A) Electrophoretic gel migration patterns of siRNA/mPEG-b-P(APNBMA)23.6 polyplexes after exposure to UV irradiation (365 nm, 200 W/m2) for varying periods of time. Free siRNA is shown for comparison. (B) Quantification of ethidium bromide fluorescence in the siRNA band using ImageJ analysis software.

