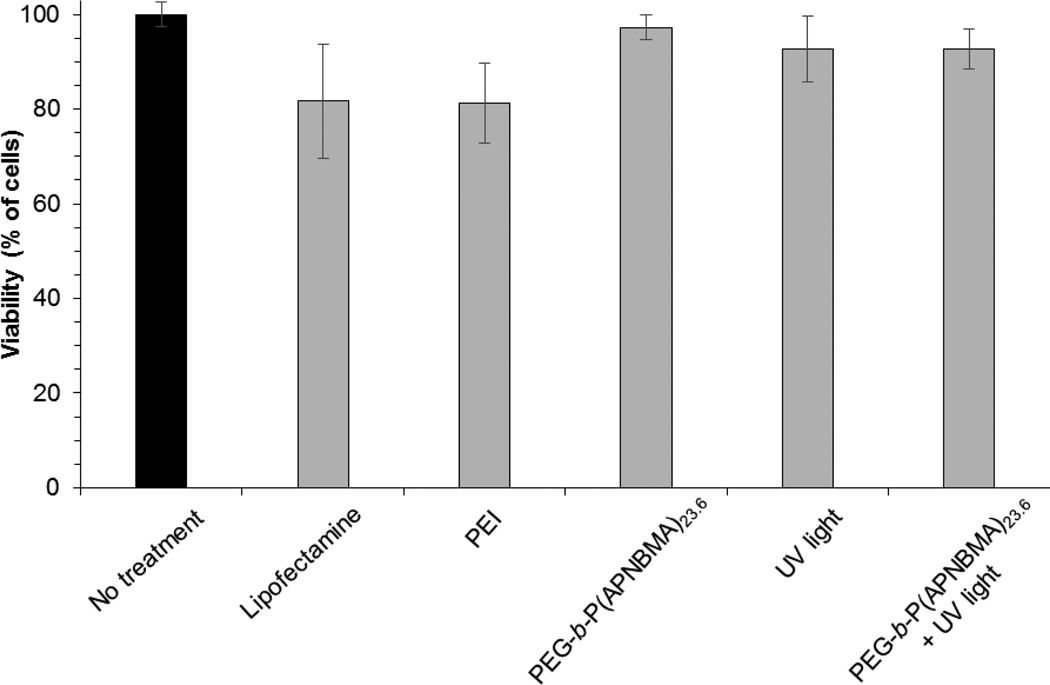
Figure 8.
Cell viabilities 48 h after polyplex treatment, UV exposure, or the combination of polyplexes and UV exposure as measured by the AB assay. Percent viabilities are relative to untreated cells. Each data point represents the mean ± standard deviation for a total of at least three separately prepared and analyzed samples. The untreated control sample is shown in black. PEI polyplexes were prepared at N/P = 6.

