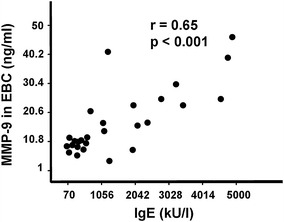
Fig. 2.

The relationship between concentration of active MMP-9 in EBC (expressed in ng/ml) and serum levels of total IgE (in kU/l). Each dot corresponds to the result of respective measurement in one individual from asthma group. The p value below 0.05 was considered as statistically significant (by Spearman correlation test)
