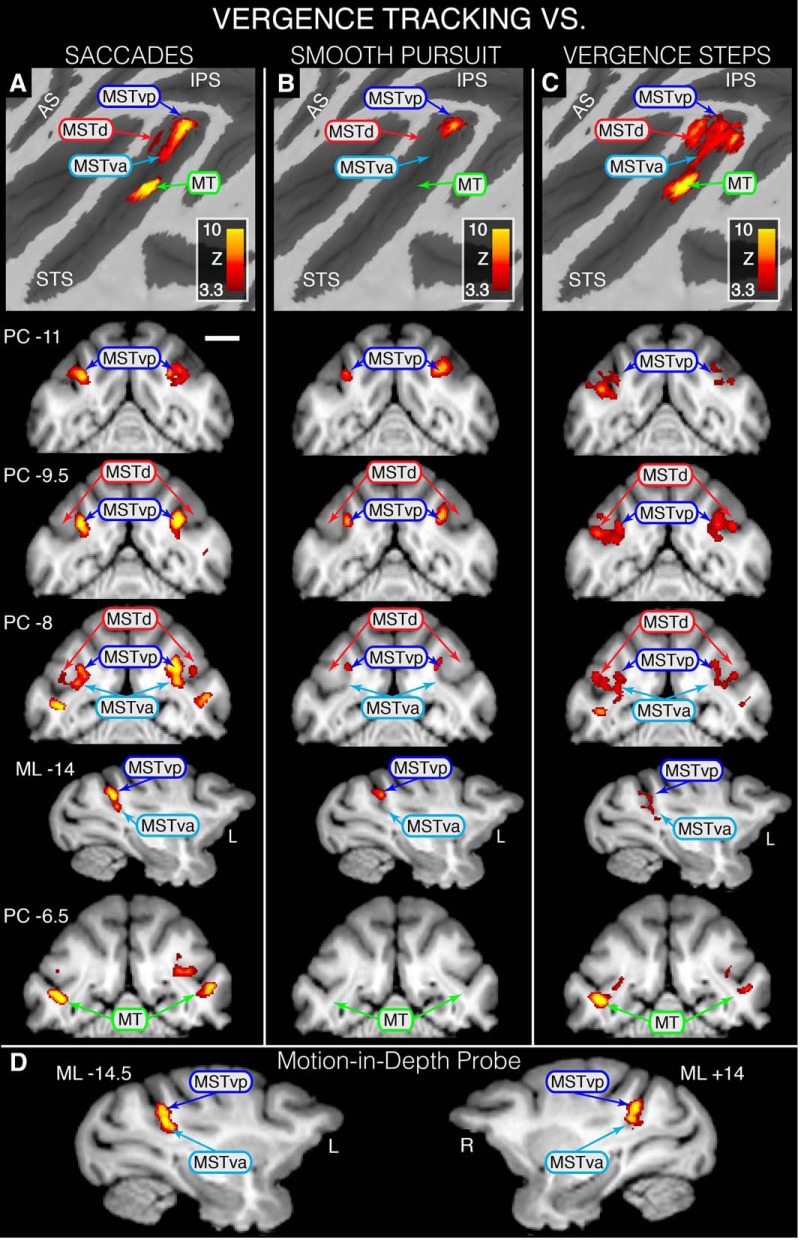
Figure 4.
Statistical maps overlaid on flattened left cortical surfaces (top row) and selected slices showing where modulation during VERGENCE TRACKING is greater than that for the other eye movement types and MIDprb. A, VERGENCE TRACKING > SACCADE contrast revealing VERGENCE TRACKING dominance in MSTvp, MSTva and foveal MT. B, VERGENCE TRACKING > SMOOTH PURSUIT contrast revealing VERGENCE TRACKING dominance in MSTvp. C, D, VERGENCE TRACKING > VERGENCE STEPS contrast revealing VERGENCE TRACKING dominance in MSTd, MSTvp, MSTva, and foveal MT (C) and VERGENCE TRACKING > MIDprb revealing dominance in MSTd, MSTvd, and MSTva (D). All areas shown are based on Nelissen et al. (2006). For all coronal slices, position is relative to the posterior commissure (PC) with a negative value denoting a position caudal to PC; sagittal slice position is relative to the midline with a negative value denoting a position in the left hemisphere. Scale bar, 1 cm. Because an STS ROI was used during GLM analyses, only activity within the STS is represented on these maps.

