Figure 12.
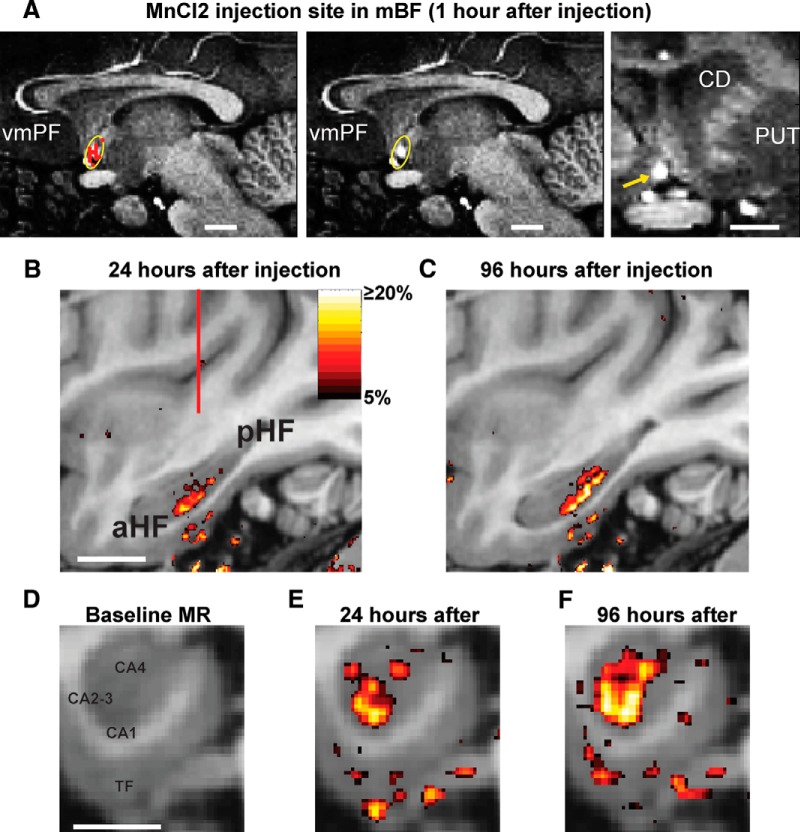
Transport of manganese chloride to the HF. A, The location of the injection site is visualized as a bright spot on sagittal (two images on the left) and coronal (right) MR images. Type 2 neurons recorded in the same monkey (classified by PCA analysis in Fig. 2) are shown in red (A, left). The 95% confidence ellipse around the neurons is shown in yellow. The same image is also shown without the neurons to observe the injection site within the confidence ellipse. White lines indicate 5 mm. CD, Caudate nucleus; PUT, putamen; vmPF, ventromedial prefrontal cortex. B, Percentage increase of voxel intensity (“MEMRI labeling”) shown in a parasagittal plane 24 h (B) and 96 h (C) after the manganese chloride injection. aHF, Anterior HF; pHF, posterior HF. D–F, MEMRI labeling shown in a coronal plane 24 h (E) and 96 h (F) after the injection. The coronal plane is focused on the HF whose structure is shown in D. CA fields are indicated within the hippocampus. TF, Parahippocampal cortical area TF. B, White line indicates 10 mm. D, White line indicates 5 mm. B, Red line indicates the location of the coronal plane shown in D–F.

