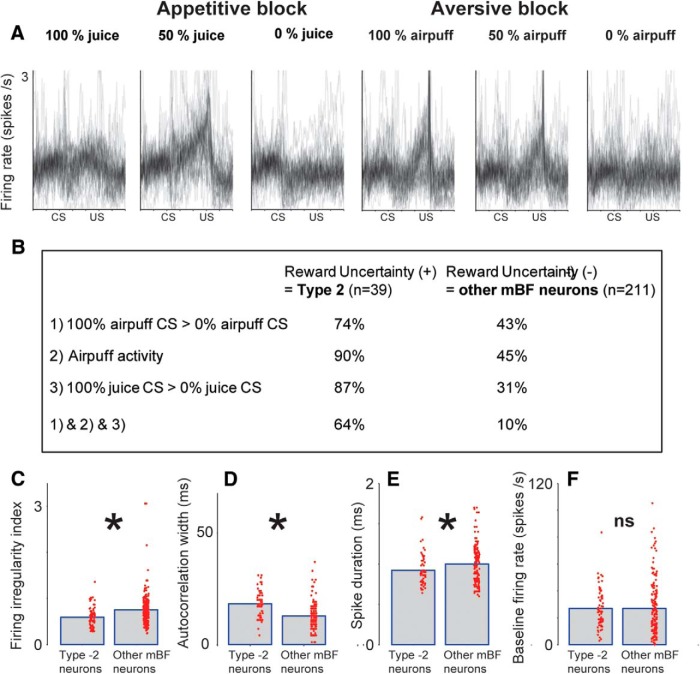
Figure 4.
Properties of Type 2 neurons in mBF. A, Activity of 39 Type 2 neurons classified by PCA analysis (Fig. 2) during 100%, 50%, and 0% predictions of rewards and punishments. For each neuron, the activity was normalized by dividing the trial firing rate by the baseline firing rate. B, Proportion of Type 2 neurons (left column) and other mBF neurons (right column) displaying aversive signals (row 1), airpuff response (activity after airpuff > greater than activity before airpuff; row 2), and reward magnitude signals (row 3). Proportion of neurons displaying all three types of signals (rows 1–3) is shown in row 4. The proportion of Type 2 neurons displaying all three activity biases (64%) was significantly higher than the random combination (random combination = 12.5% binomial test; p < 0.0.01). C–F, Baseline firing characteristics of all Type 2 neurons recorded during all experiments in this study compared with other neurons in the mBF. Bar plots represent means. Single red dots indicate single neuron data. C, Firing irregularity indices. D, Autocorrelation width. E, Spike wave trough-to-trough duration. F, Baseline firing rate. *p < 0.05 (Wilcoxon rank sum test). ns, Not significant.

