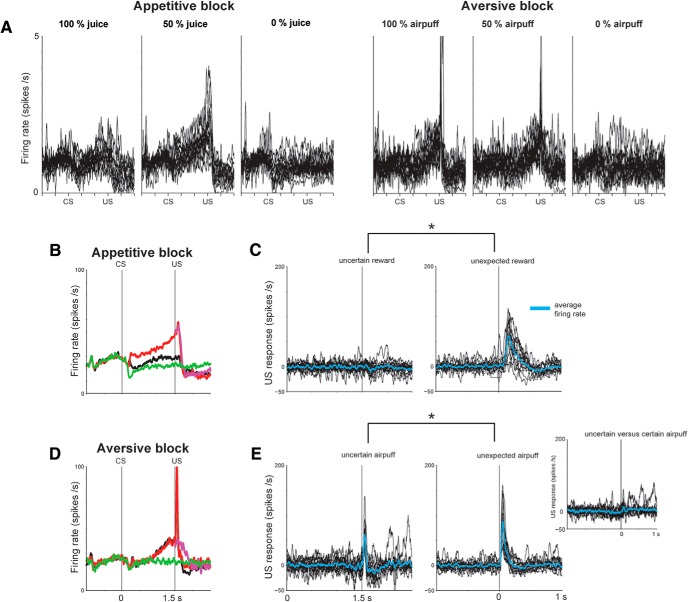
Figure 5.
Response of single mBF Type 2 neurons to rewards and punishments. A, Activity of single Type 2 neurons during 100%, 50%, and 0% predictions of rewards and punishments (n = 14: 5 from Monkey H, 9 from Monkey P). For each neuron, the activity was normalized by dividing the trial firing rate by the baseline firing rate. B, Their average activity in the appetitive block. Conventions are the same as in Figure 1. C, Left, Difference in activity during trials in which rewards were delivered and not delivered after the 50% CS epoch (B, red vs pink trace). Single neuron activity (black) and average (blue) are shown. Right, Baseline-subtracted activity of the same neurons to unexpected rewards during the ITI. *p < 0.05, significant difference between the two conditions (left vs right; paired signed rank test). D, Average activity in the aversive block. E, Left, Difference in activity during trials in which airpuffs were delivered and not delivered after the 50% CS epoch. Right, Baseline-subtracted activity to unexpected airpuffs during the ITI. Same conventions as in C. Inset, Difference between less predicable airpuffs (after 50% CS epoch) and fully predictable airpuff responses (after 100% CS epoch).

