Figure 8.
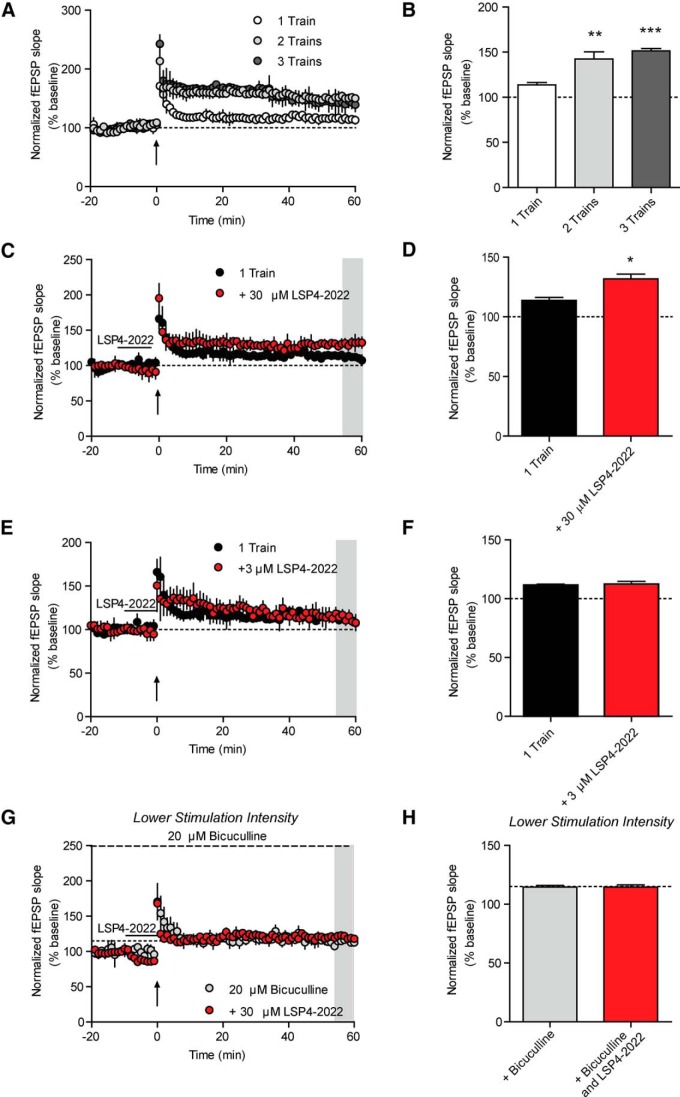
Agonism of mGlu7 potentiates submaximal LTP. A, Three different high-frequency stimulation paradigms were used to induce varying levels of LTP. One train of 100 Hz stimulation induced a submaximal level of LTP, whereas 2 or 3 trains of 100 Hz stimulation both induced saturated LTP. Upward facing arrows indicate all HFS stimulations. B, Quantification of LTP as determined by averaging the values during the last 5 min of recording (shaded gray area in A). Values represent mean ± SEM (overall: p = 0.0005, one-way ANOVA with Bonferonni's post-test, 1 train vs 2 trains, **p < 0.01, 1 train vs 3 trains, ***p < 0.001, n = 3 or 4, df = 2, 8). C, Pretreatment with 30 μm LSP4-2022 significantly potentiated LTP induced by application of 1 train of 100 Hz stimulation. D, Quantification of LTP as determined by averaging the values during the last 5 min of recording (shaded gray area in C). Values represent mean ± SEM. *p = 0.012 (two-tailed Student's t test). n = 3 or 4; df = 5. E, Pretreatment with 3 μm LSP4-2022 did not significantly alter the level of LTP induced by application of 1 train of 100 Hz stimulation. F, Quantification of LTP as determined by averaging the values during the last 5 min of recording (shaded area in E). Values represent mean ± SEM. p > 0.05 (two-tailed Student's t test). n = 3 or 4; df = 5. G, The 20 μm bicuculline was bath applied to slices, and the stimulation intensity was reduced such that the slope of the baseline fEPSPs was similar in magnitude to the 50% maximum fEPSP slope in normal aCSF determined via an intensity input–output curve. Pretreatment with bicuculline alone or with a 10 min treatment with 30 μm LSP4-2022 (black line) did not significantly enhance the level of LTP induced with 1 train of 100 Hz stimulation (upward facing arrow). Small dashed line indicates the level of LTP induced in normal aCSF. H, Quantification of LTP as determined by averaging the values during the last 5 min of recording (shaded area in G). Dashed line indicates the level of LTP induced in normal aCSF. Values represent mean ± SEM (overall: p = 0.3258, one-way ANOVA with Bonferonni's post-test). n = 3 or 4; df = 2, 8.

