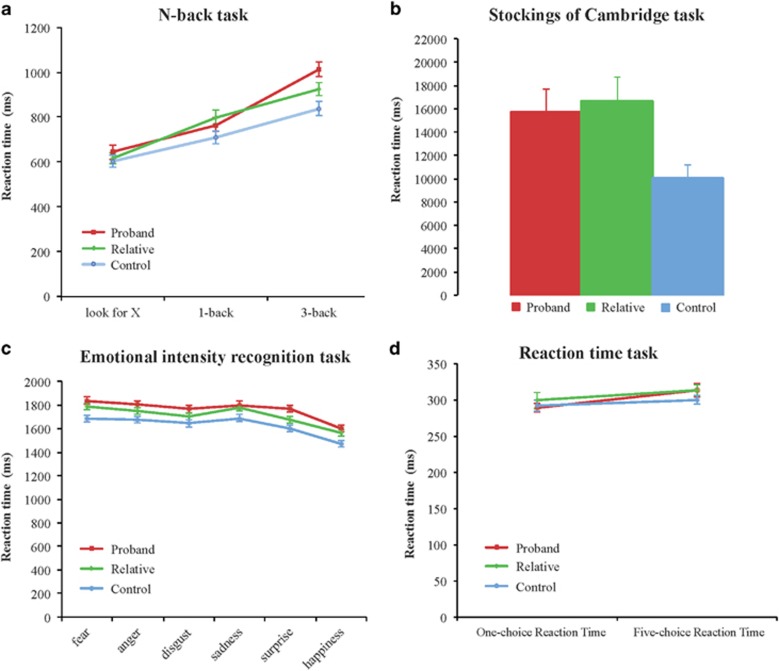
Figure 1.
Cognitive, emotional and motoric reaction time responses. (a) Reaction time on the n-back task showed that probands (red lines, n=32), relatives (green lines, n=34) and controls (blue lines, n=33) were slower according to task difficulty. The three groups did not present any differences in reaction time for the ‘look for X' and the 1-back tasks (P>0.05), but they did for the 3-back task (P<0.05), with probands being significantly slower than controls, and relatives having a pattern in between the two. (b) Reaction time on the CANTAB Stockings of Cambridge (SOC). Probands (n=32) and relatives (n=34) were significantly slower compared with controls (n=32) (P<0.01). (c) Latency of each emotion from the Emotion Intensity Recognition Test (EIRT). Latencies in the EIRT task showed that probands were slower at recognising intensities for all emotional faces compared with controls (P<0.05). They were also slower than their relatives to recognise surprise. Relatives, in turn, were significantly slower than controls to recognise fear, sadness and happiness facial intensities (P<0.05). (d) Latency on the CANTAB one- and five-choice reaction time. There were no statistical differences between the three groups (P>0.05). Error bars represent s.e.m.

