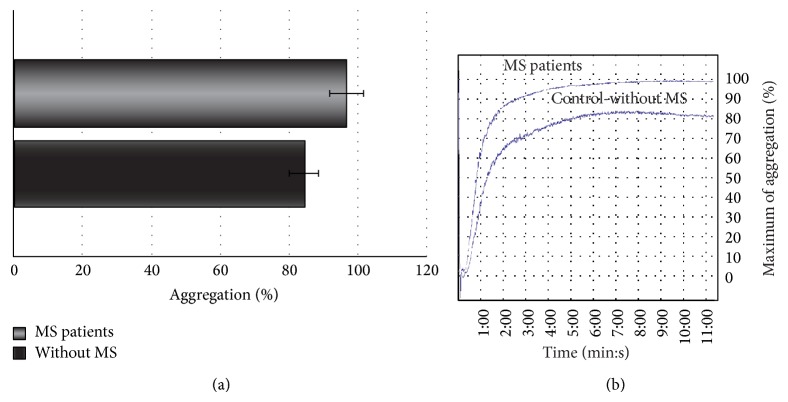
Figure 3.
The blood platelet aggregation induced by ADP in platelet-rich-plasma (PRP). (a) The data are presented as means ± SD (n = 50; ∗ p < 0.0001 SP MS platelets versus control (without MS) by Mann-Whitney U test). (b) The typical curve of platelet aggregation after stimulation of platelets by ADP (Chrono-Log aggregometer, Havertown, PA).

