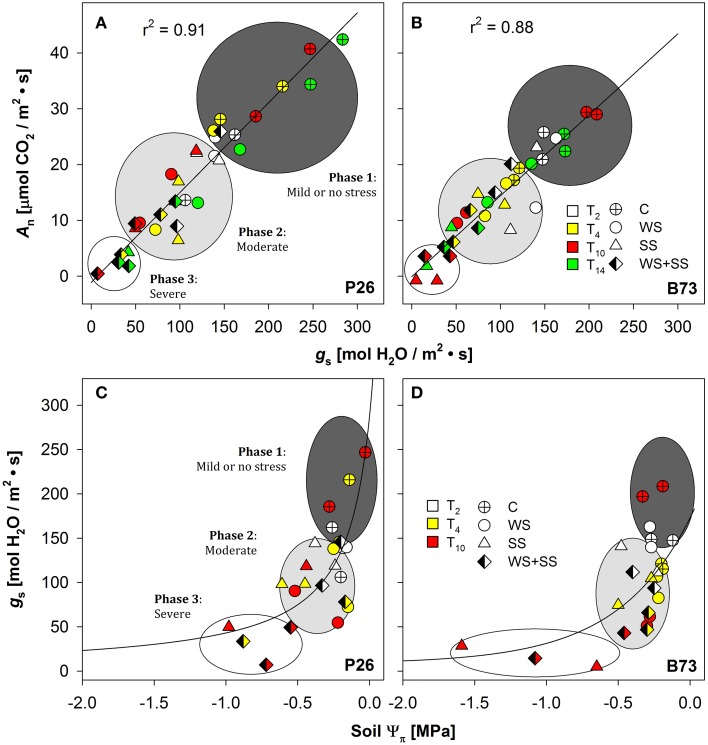
Figure 5.
Stomatal conductance (gs) in (A) P26 [y = −2.75 + (265.79 · x)/(1367.33 + x), R2 = 0.91] and in (B) B73 [y = −0.89 + (220.5 · x)/(1312.94 + x), R2 = 0.88] as a function of net CO2 assimilation rate (An), or soil osmotic potential (Ψπ) in (C) P26 [y = 287.8 · −0.18/(−0.18 + x), R2 = 0.54] and in (D) B73 [y = 299.73 ·− = 0.16/(-0.16 + x), R2 = 0.37] in well-watered (C), water-stressed (WS) salt-stressed (SS) and their combination (WS+SS) plants of the two genotypes, P26 and B73. Each color corresponds to measurements at different time points (T0, 2, 4, 10, and 14). The curve of best fit for (A,B) and (C,D) plots was a single rectangular hyperbola and a hyperbola decay function, respectively. Three main regions are distinguished along the curves using gs as a reference parameter: mild or no stress (Phase 1), moderate (Phase 2) or severe stress (Phase 3).

