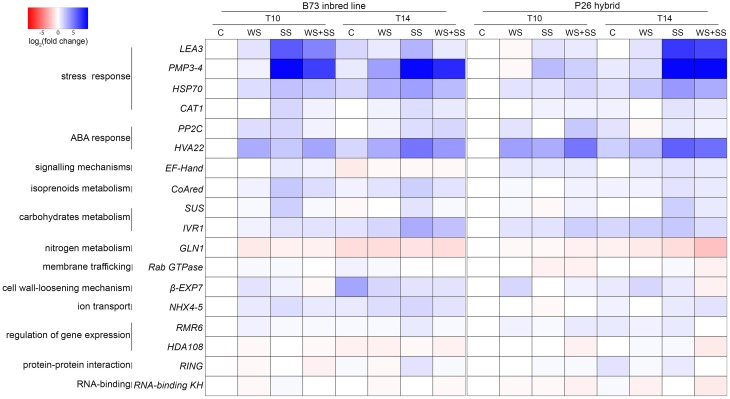
Figure 6.
Heat map representing the relative quantification of gene expression in maize leaves of B73 inbred line and hybrid P26 at two time points, after 10 days of stress (T10) and 4 days of recovery (T14) following the application of drought (WS), salinity (SS), and drought+salinity (WS+SS). The maize GAPC2 gene was selected as internal control. Each experiment was run in triplicate. Data from qRT-PCR experiments were analyzed according to the Pfaffl method and gene expression was calculated as the fold change (FC) relative to the expression level of the control non-stressed sample (C) of the same genotype at T10. Cell colors represent the log2(FC) values: blue color for higher relative expression values, red color for lower relative expression values.

