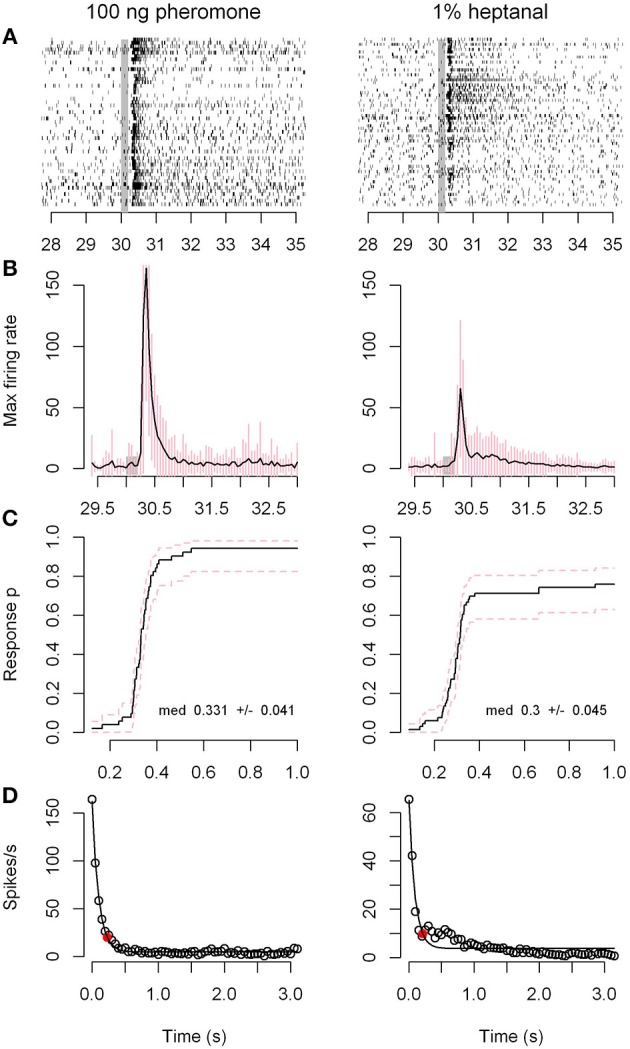
Figure 2.

Response dynamics of Phe-ORNs to the pheromone or heptanal are very similar. The dynamics of the response of ORNs sampled on antennal branches to a 200 ms pulse of 100 ng pheromone (left column) or 1% heptanal (right column) are compared. (A) Raster plots of the firing activity of 51 individual neurons. The vertical gray bars show the stimulus time. (B) Frequency plots of the maximum firing rates for the same sample of neurons (time bin = 50 ms). Means of the 51 recordings. Error bars in pink represent standard deviation. (C) Kaplan-Meier curves of the response latencies; p is the proportion of neurons that responded to the olfactory stimulus at a given time. (D) Exponential decrease model for response end. The red dots represent the estimated values for 90% decrease.
