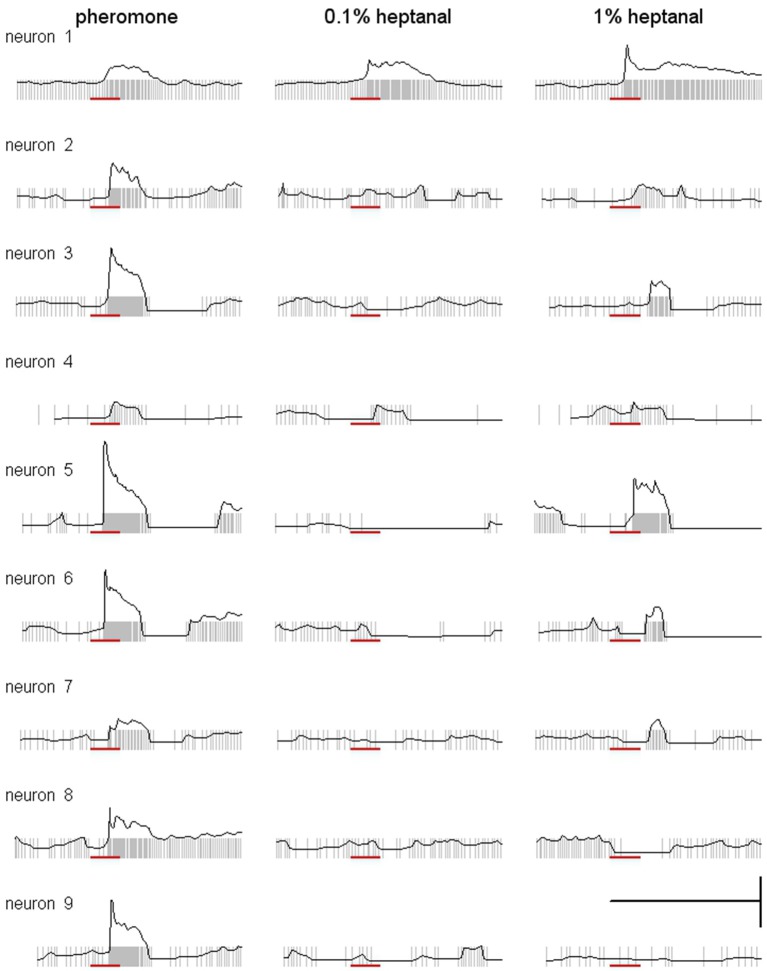
Figure 8.
Heptanal evokes more variable responses in MGC neurons than the pheromone. Superimposed raster and frequency plots of responses of MGC neurons illustrating the variability of responses to heptanal between neurons and between pheromone and the two concentrations of heptanal within neurons. Scale: vertical bar = 100 spikes, horizontal bar = 1 s. Red bar indicates the stimulus (200 ms).

