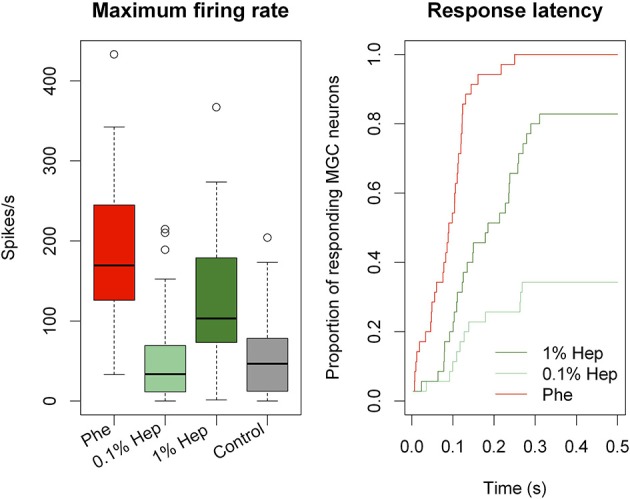
Figure 9.

Quantitative analysis of MGC neuron responses to the pheromone and heptanal. Boxplot of mean maximum firing rates (Box = median with first and third quartiles, whiskers = second and fourth quartiles, circles = outliers) and Kaplan-Meier estimator curves for the latencies of MGC neuron (n = 35) responses. MGC neurons respond with lower maximum firing rates and longer latencies to 0.1 and 1% heptanal compared to the pheromone. Control refers to pooled data of stimulation with pure hexane and pure mineral oil. Hep, heptanal; Phe, pheromone.
