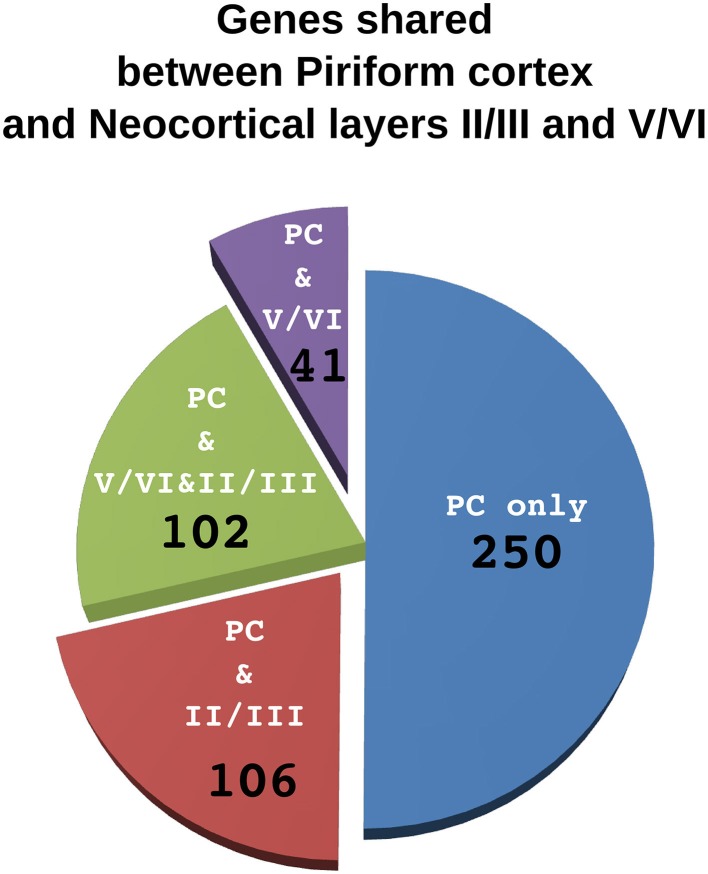
Figure 4.
Comparison of genes shared by piriform cortex and laiers II/III or V/VI of the neocortex. The pie chart represents the 500 genes enriched in the piriform cortex. Each sector indicate the number of genes shared only with layers V/VI (violet), only with layer II/III (red) or with both layer II/III and V/VI (green). The fraction of genes that are not enriched neither in layer II/III nor in layer V/VI are in blue.

