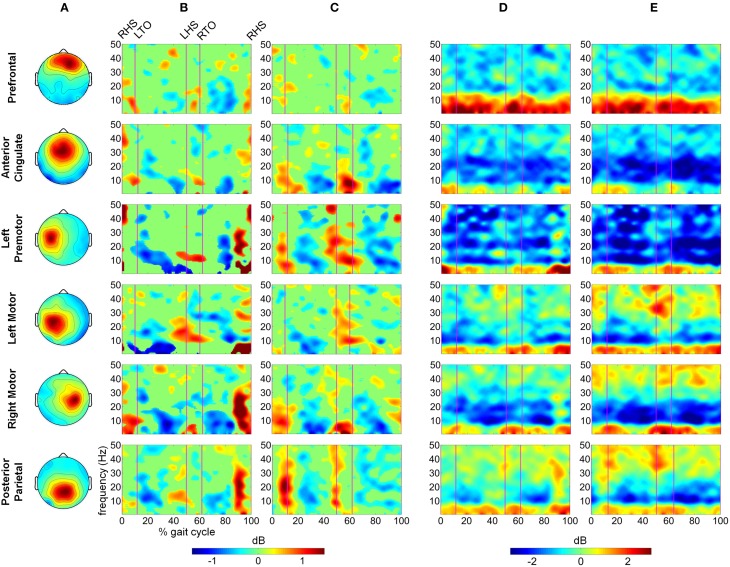
Figure 5.
Time frequency decomposition of cortical clusters during steady, slow treadmill walking. (A) The average topographical scalp projections of independent components comprising the six cortical clusters. Grand mean time frequency amplitude ratio to the mean gait cycle spectrum, constituting gait cycle event related spectral perturbations (ERSPs) for each cluster during (B) passive and (C) active treadmill walking. Event related desynchronization (ERD) and synchronization (ERS) during (D) passive and (E) active treadmill walking relative to quiet standing for each cluster.

