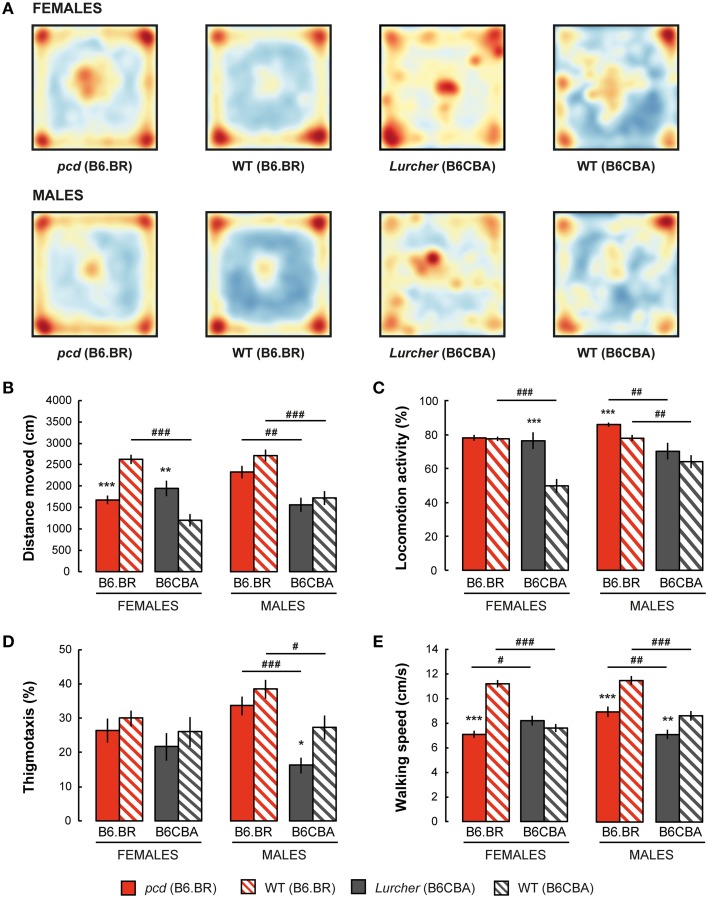
Figure 2.
Open field test: (A) Superposition of trajectories (frequency of animal presence) for females and males in the arena; (B) Total distance moved (cm); (C) Percentage of time spent with locomotion activity (%); (D) Percentage of thigmotaxis (% moved distance in the 3 cm border zone) and (E) Mean walking speed (cm/s) during locomotion activity periods. Statistical significance was evaluated using a permutational t-test. Within-strain comparison: *p < 0.05, **p < 0.01, and ***p < 0.001. Between-strain comparison: # p < 0.05, ## p < 0.01, and ### p < 0.001. Data are presented as mean ± SEM.

