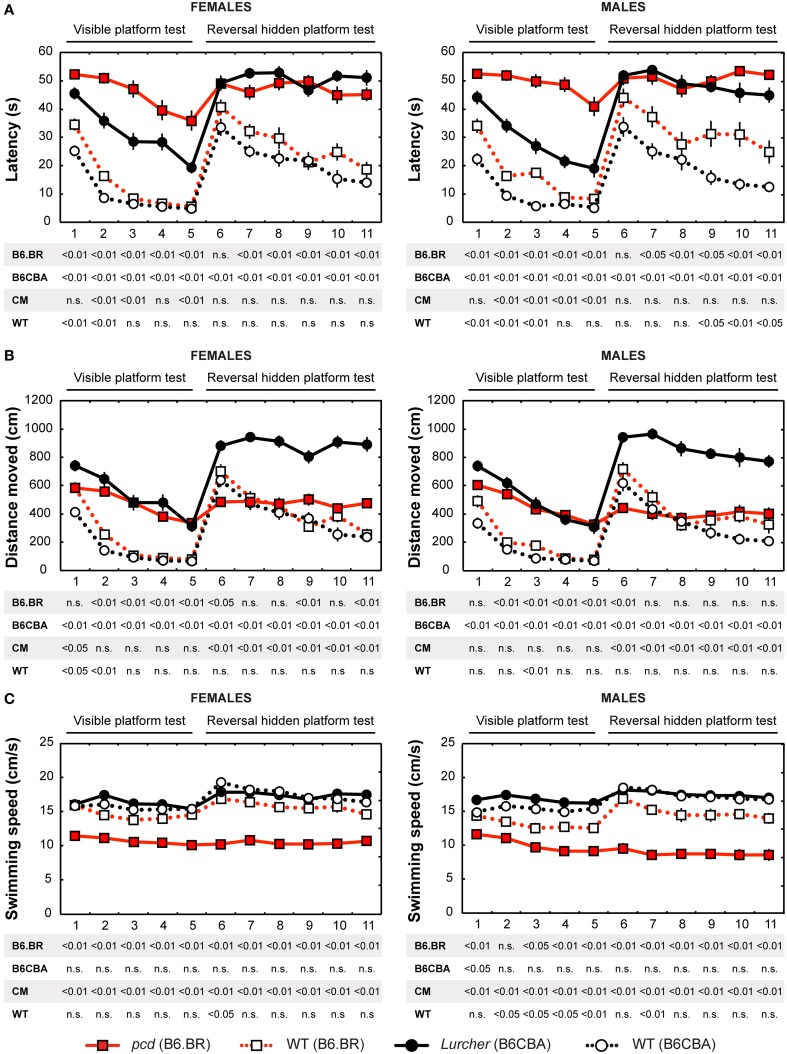
Figure 3.
Morris water maze: (A) Mean escape latency (s); (B) Total distance moved (cm) and (C) Mean swimming speed during periods of active swimming (cm/s). Statistical significance was evaluated using permutational t-test with Bonferroni correction for the repeated measurement for within-strain comparisons (pcd vs. B6.BR wild type, Lurcher vs. B6CBA wild type) as well as for between-strain comparisons of cerebellar mutants (CM; pcd vs. Lurcher) and wild types (WT; B6.BR WT vs. B6CBA WT). Data are presented as mean ± SEM.

