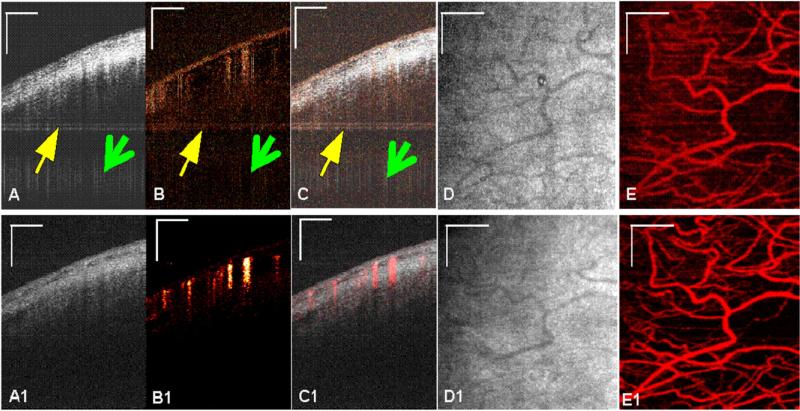
Figure 3.
In vivo images of human sclera (away from limbus) using SSpvOCA. Top and bottom panels show images before and after phase stabilization, respectively (A) and (A1): Average intensity image of three B-scans (B) and (B1), phase-variance processed image using phase data from the same three B-scans (C) and (C1), composite image of (A) and (B), (D), (D1) intensity projection image of (A), (E) and (E1) phase variance projection of (B). Scale bar: 0.5 mm.

