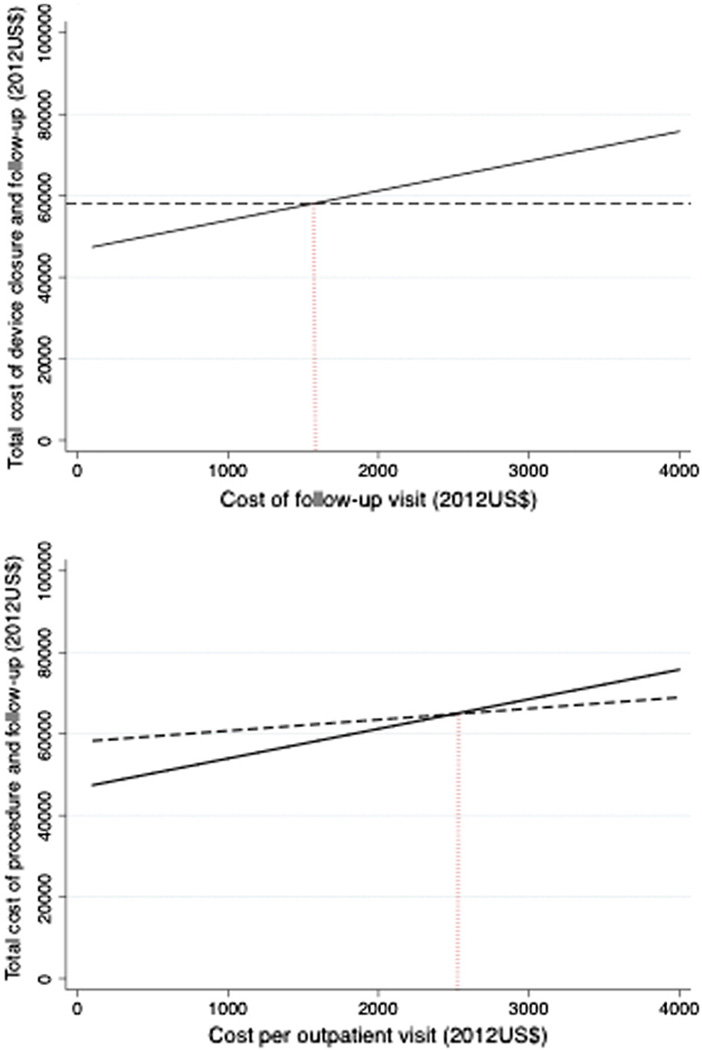
Figure 3.
Effect of cost of follow-up visits on total cost. Graphs depict total cost of closure of ASD (2012 US$) over a range of possible costs for follow-up visits. In both analyses, total cost of transcatheter closure (solid line) and operative closure (dashed line) are depicted. The cost of follow-up visit at which there is cost equivalence is depicted (red dotted line). Panel A depicts the most conservative model in which the operative cohort does not receive follow-up and transcatheter cohort receives follow-up for 5 years as per FDA recommendations. Cost equality is reached at a cost of 2012 US $1,559 per visit. Panel B depicts a model in which operative cohort receives 1-week, 1-year, and 5-year follow-up visits. Cost equality is reached at a cost of 2012 US $2,494 per visit.

