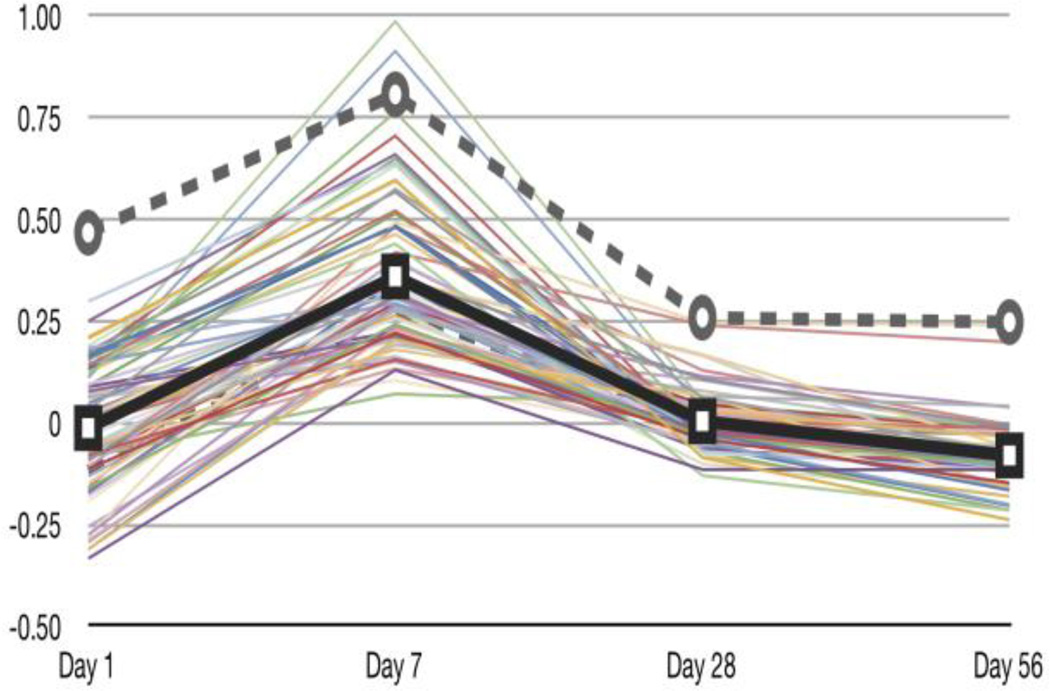
Figure 3.
Average gene expression of the leading sets of pathways significant in Pattern 1 of Dose 80 using a non-constrained search. The average gene expression of the leading sets is in bold. Pattern 1 of Dose 80 resembles the lung inflammation phenotype (dashed line) for Dose 40 from Porter et al. [2]

