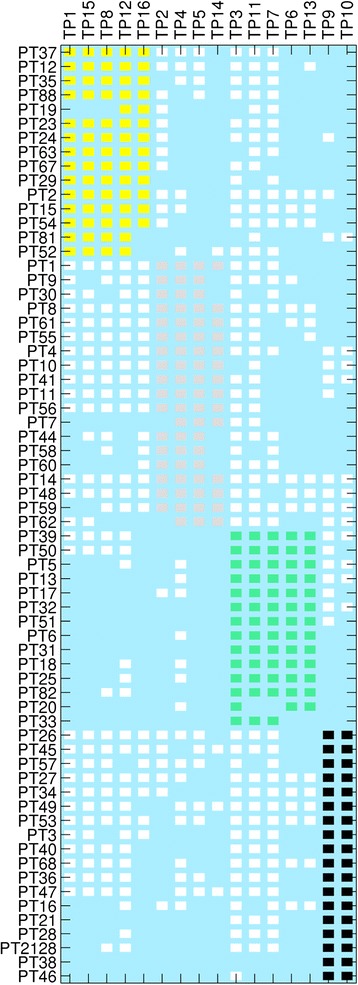
Figure 2.

A visual representation of the modularity seen within the system with modules coloured. Phage type (PT) is represented on the y axis and Typing phage (TP) is represented on the x axis and the matrix showing presence of a reaction with that phage as a white or coloured block. The 4 observed modules are coloured as yellow, pink, green and black.
