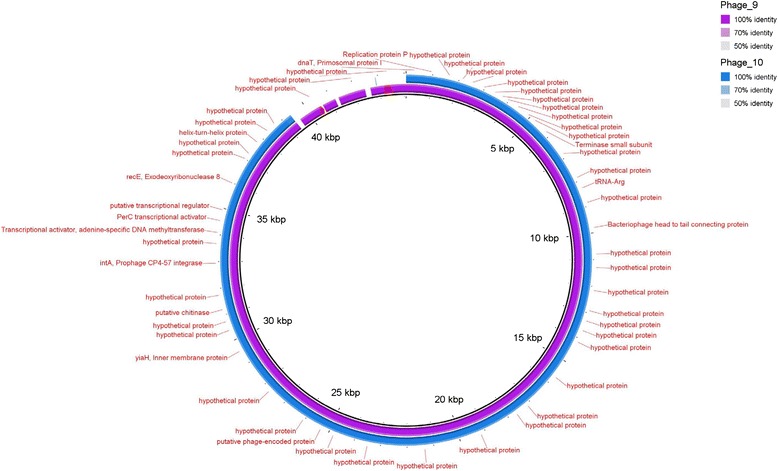
Figure 7.

A genomic representative diagram drawn with BRIG, the coloured regions indicate high pairwise genomic sequence similarity according to blastn. The legend indicates which colours correspond with which phages. The central ring is a genbank file of Phage 9 as a reference and annotations of genes in red. The first ring is representative of Phage 9 and the second ring is representative of Phage 10 and the shade indicates the level of genomic similarity observed.
