Figure 2.

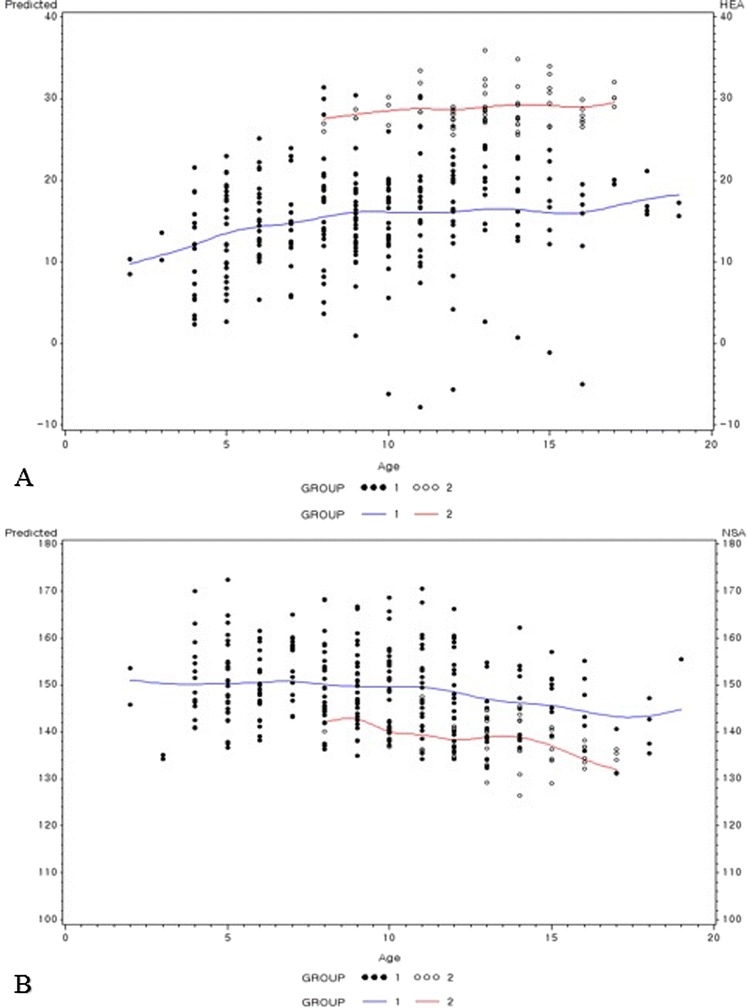
The values for the measured angles. The lines represent the estimation of the development of each parameter by a linear age affect in the two groups. (A): the HEA (B): the NSA.

The values for the measured angles. The lines represent the estimation of the development of each parameter by a linear age affect in the two groups. (A): the HEA (B): the NSA.