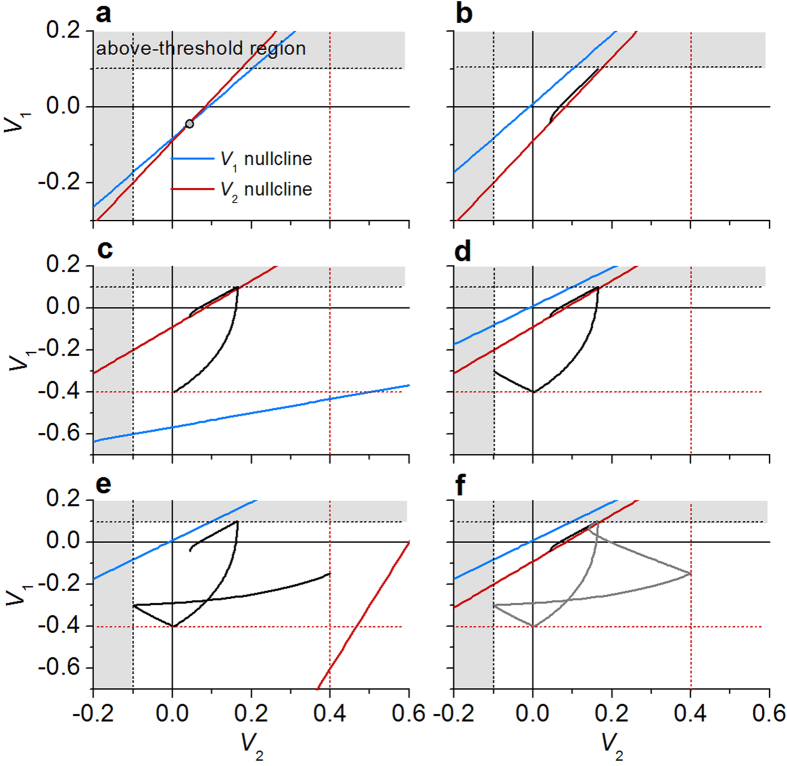
Figure 4. Spiking dynamics on two-dimensional phase-plane.
(a) V1- and V2-nullcline and a stable fixed point (grey circle) when Iin = 0. The white area denotes the sub-threshold region. (b–f) Changes in the V1- and V2-nullcline upon threshold switching of S1 and S2 and the consequent trajectory of V1 and V2 on the phase-plane. The grey cycle in (f) shows the corresponding limit cycle. The black and red dashed lines mean thresholds for on- and off-switching, respectively.

