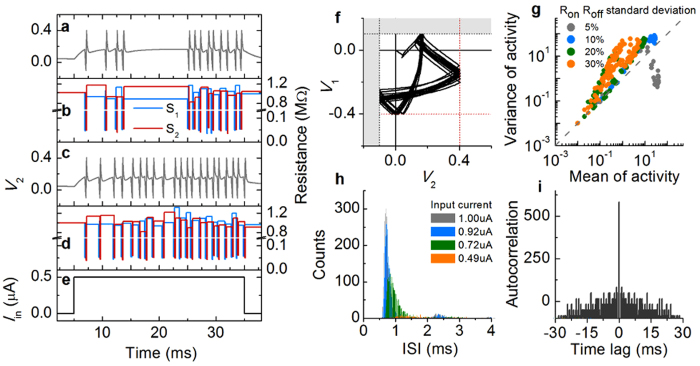
Figure 6. Poisson-like noise of NLIF neuron.
(a) Noisy response of the NLIF neuron with 10 percent resistance deviation and (b) the corresponding fluctuation of resistance of TSs in time. (c) Another set of noisy response and (d) resistance fluctuation under the same condition. The input current for both cases is plotted in (e). (f) Spiking dynamics in (a), mapped onto the phase-plane for the dynamics. (g) Variance of activity with respect to mean activity for the four different resistance deviations (5, 10, 20, and 30 percent). (h) ISI distribution for the case of 10 percent of resistance deviation at four different Iin values (1.00, 0.92, 0.74, and 0.49 μA). (i) Autocorrelation of spikes in a train at 0.5 μA input current and 10 percent of resistance deviation.

