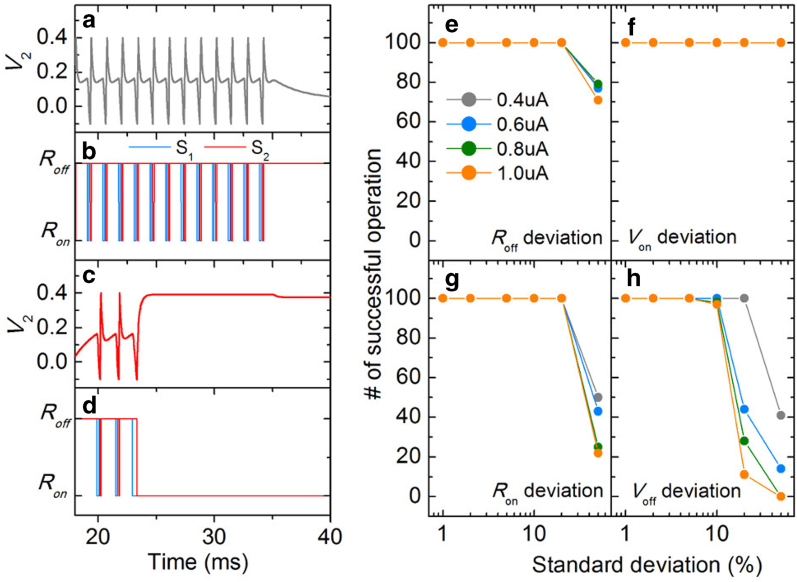
Figure 7. Failure of spiking.
(a) Successful spiking example and (b) the corresponding variation of resistance of TSs. (c) Evolution of membrane potential in time in case of failure and (d) the corresponding change of resistance of TSs. This failure arises from switch S2 being stuck to its on-state. The number of successful spiking events on 100 trials was evaluated at given standard deviation of each switching parameter while the other parameters are fixed: (e) Roff, (f) Von, (g) Ron, and (h) Voff. The evaluation was done at four different input currents (0.4, 0.6, 0.8, and 1.0 μA). The circuit parameters in use, encompassing the mean values of Roff, Von, Ron, and Voff, are listed in Table 2.

