Figure 1.

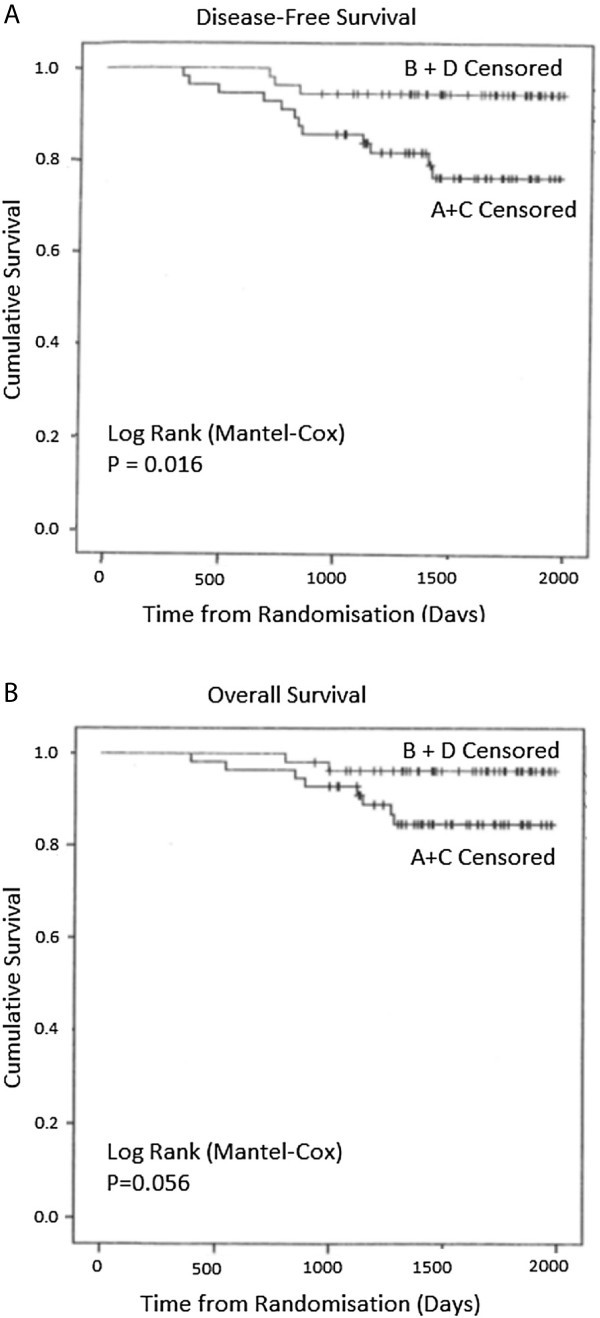
Kaplan-Meier Survival curves for (A) DFS ( χ 2 = 5.802, df1, p = 0.016) and (B) OS ( χ 2 = 3.639, df1, p = 0.056) at a median follow-up period of 4 years and 3 months (Log Rank [Mantel-Cox]).

Kaplan-Meier Survival curves for (A) DFS ( χ 2 = 5.802, df1, p = 0.016) and (B) OS ( χ 2 = 3.639, df1, p = 0.056) at a median follow-up period of 4 years and 3 months (Log Rank [Mantel-Cox]).