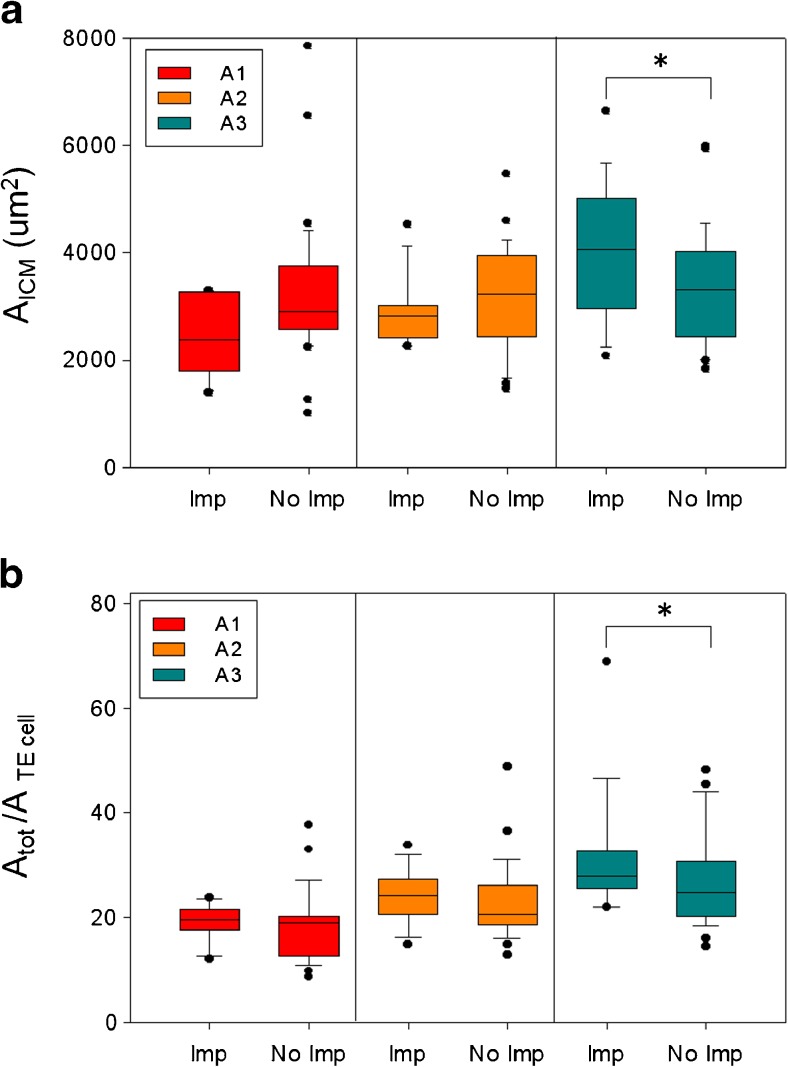
Fig. 3.
ICM area, TE cell number and Implantation Rate. ICM area (a) and TE cell number (b) distributions in implanted (Imp) and not implanted (No Imp) blastocysts summarized as box plots. A1, A2 and A3 are the blastocyst expansion categories. A significant difference in ICM area of implanted vs. not implanted blastocysts exists in A3 blastocysts as well as in TE cell number (*p < 0,05). Box plots show the 10th, 25th, 50th (median), 75th, and 90th percentiles and outlier are plotted as individual points. Group variance was analysed by ANOVA followed by Tukey-Kramer test for comparison between multiple groups

