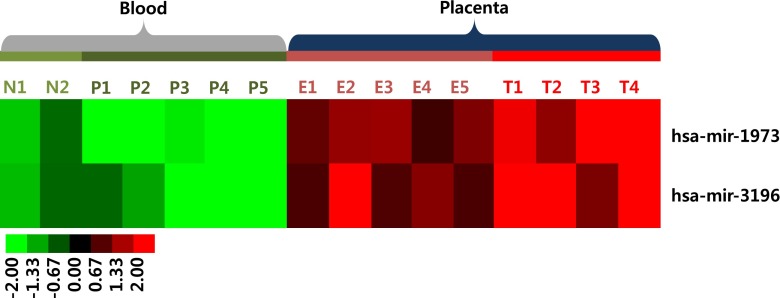
Fig. 2.
Expression pattern of miRNA candidates for noninvasive prenatal testing of fetal trisomy 21. miRNAs were clustered using the Pearson uncentered distance metric with average linkage. Each column represents an individual sample and each row represents an individual miRNA. Expression levels of miRNAs are shown in red (up-regulated) and green (down-regulated), with brighter shades indicating higher fold differences. N: non-pregnant, P: pregnant, E: euploid fetus, T: trisomy 21 fetus

