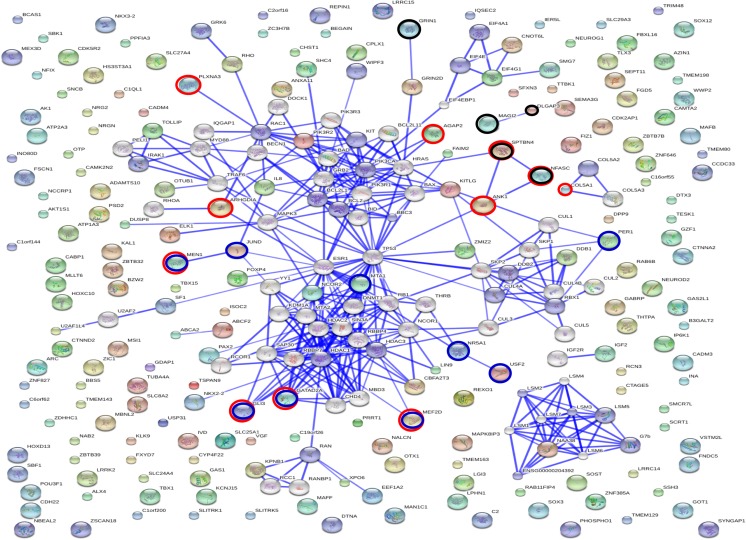
Fig. 5.
Interaction networks of target genes of mir-1973 and mir-3196. The list of the identified target genes was subjected to STRING (v. 9.05) analysis to reveal functional interactions. Each node represents a protein, and each edge represents an interaction. Black, red, and blue circles show genes that are involved in neuron projection, nervous system development, and sequence-specific DNA binding, respectively

